Our 2026 Q1 Investment Update
Our first-quarter investment update offers a snapshot of how investments have performed, addresses common client questions, and examines the key themes shaping today’s news and tomorrow’s investment landscape.
Periodic Table of Asset Class Returns
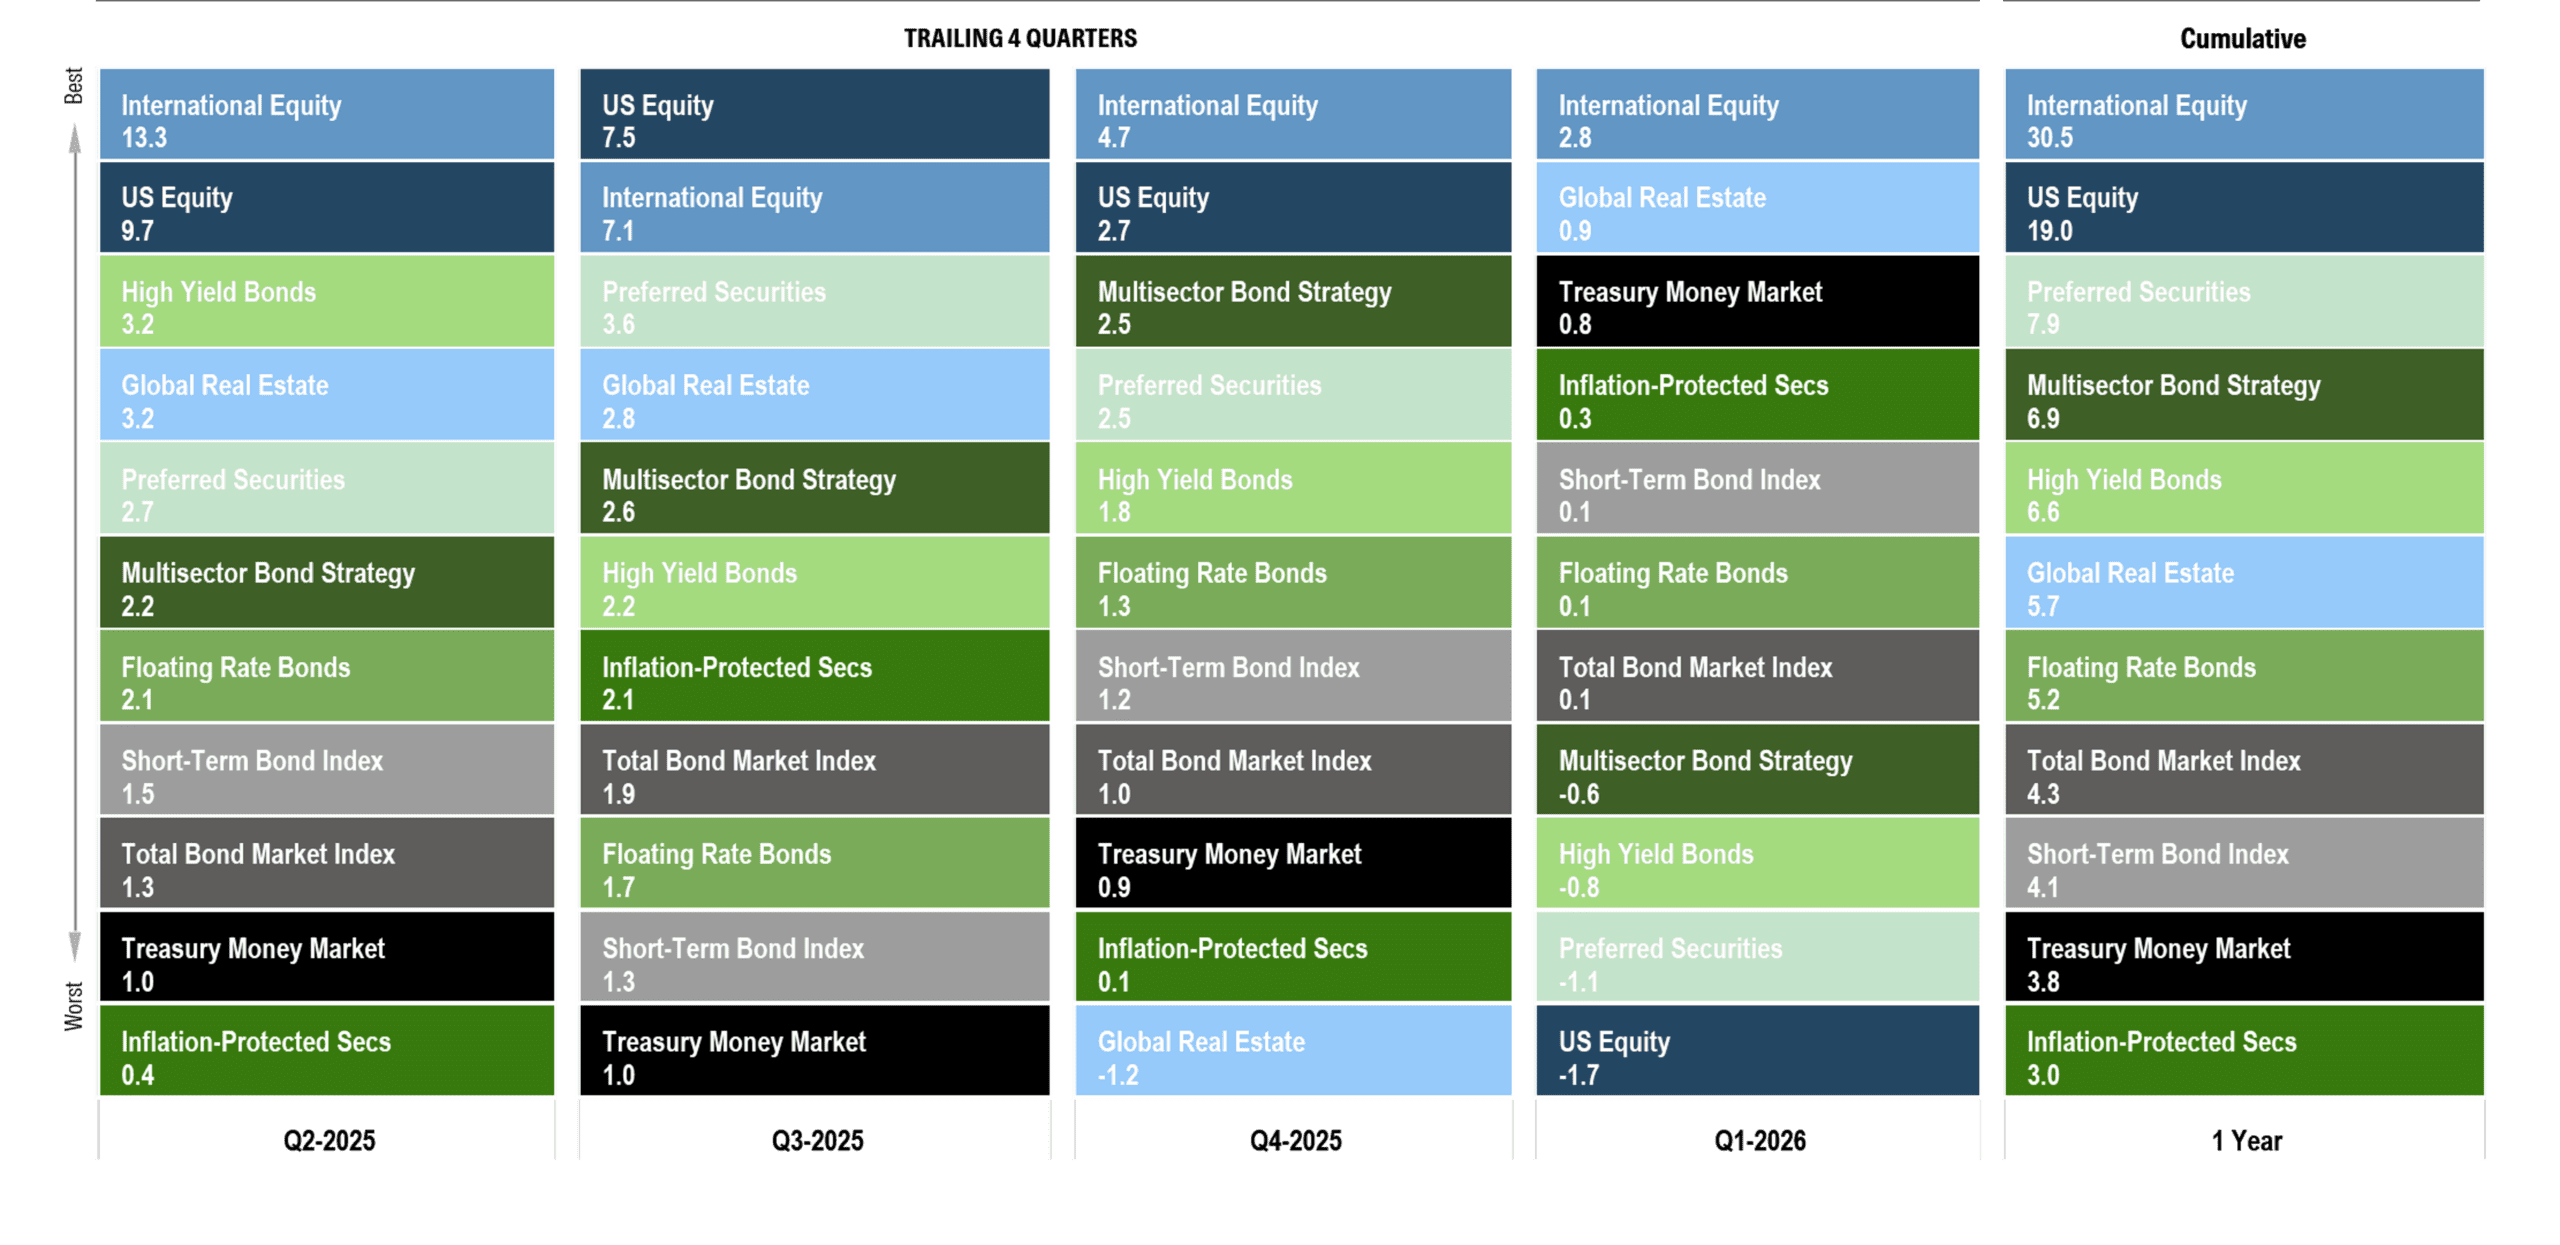
About this chart: This chart illustrates the performance of core public market segments for the prior four quarters and for the trailing one-year period. Each segment is represented by a different color and ranked from highest to lowest return for each period. This information is provided for illustrative purposes only and does not represent the performance of any Brighton Jones client portfolio. Past performance is not indicative of future results.
Key takeaways:
Looking at the trailing one-year returns from Q2-2025 through Q1-2026, it is worth pausing on what investors actually had to live through to earn those results. Positive returns rarely come in a straight line, and the past twelve months offered a good reminder of that. Last April, Liberation Day triggered a sharp tariff-driven selloff that sent the U.S. stock market down 20% and created no shortage of unsettling headlines. Then, last month, major military escalation across the Middle East added another layer of uncertainty, with oil prices jumping from about $57 per barrel at the beginning of the year to more than $110.
And yet, despite that backdrop, every asset class shown on this chart delivered a positive return for the 1-year period ending Q1-2026. International equity gained more than 30%, U.S. equity returned 19%, and fixed income sectors on average provided a healthy premium over cash. That is often how investing works in real life. The path can feel uncomfortable in the moment, even when the longer-term outcome ends up being favorable.
The recent quarter offered another good example of why context matters. On average, a diversified portfolio will have finished the quarter roughly flat. On the surface, that may not sound especially notable. But considering the environment, it felt more like a resilient outcome than an unremarkable one.
After the joint U.S. and Israeli military campaign began in Iran last month, markets faced a fresh wave of uncertainty. Oil prices doubled, the 10-year Treasury yield climbed from around 4.0% to nearly 4.5%, and precious metals sold off sharply from recent highs. While the core market segments in our portfolios experienced only a moderate decline, diversification helped cushion the volatility. In that kind of environment, a roughly flat quarter can still represent a meaningful win.
Data Disclosures: Treasury Money Market: Fidelity Treasury Money Market. Short-Term Bond Index: Vanguard Short-Term Bond Index. Total Bond Market Index: Vanguard Total Bond Market Index. Inflation-Protected Treasuries: Vanguard Inflation-Protected Securities. Multisector Bond Strategy: PIMCO Income. Floating Rate Bonds: Fidelity Floating Rate. High Yield Bonds: PIMCO High Yield. Preferred Securities: Nuveen Preferred Securities. U.S. Stocks: DFA US Core Equity I. Foreign Stocks: DFA World ex US Core Equity. Global Real Estate: DFA Global Real Estate. Data source: Morningstar Direct.
Stock Market Returns and the Price of Oil

About this chart: Each chart plots annual U.S. stock market returns against a different dimension of oil: the year-over-year change in price (left) and the inflation-adjusted price level (right). Each dot represents one calendar year, with data going back to 1970.
Key takeaways:
When oil prices doubled in the span of a few weeks following the escalation of military activity in the Middle East, it was reasonable to wonder what that might mean for stocks.
Oil prices matter to discretionary consumer spending, the profit of specific industries, and to inflation dynamics, but as a signal for where the broad stock market might be headed, they have historically told us very little.
Strong stock market years have occurred alongside high and surging oil prices, and weak stock market years have occurred when oil was cheap and falling. Whether we compare stock market returns to the absolute price level of oil or to changes in the price of oil, the pattern in both cases is essentially a scatter plot that offers no predictive value.
This is part of why we do not position portfolios around macro forecasts. Many relationships that seem intuitive on the surface do not hold up when tested against historical data. Investors who fared best over the past year were likely not the ones who correctly anticipated what oil, tariffs, or geopolitics would do. They were the ones who stayed invested and let a diversified and thoughtfully-constructed portfolio do its work.
Data Disclosures: Source: MacroTrends; Dimensional Returns 2.0
US Dollar Index

About this chart: This chart shows the U.S. Dollar Index (DXY) since the end of the global financial crisis. The index represents a weighted average value of the dollar against select currencies, including the euro, Japanese yen, British pound sterling, Canadian dollar, Swedish krona, and Swiss franc. Past performance is not indicative of future results.
Key Takeaways:
Last quarter, we noted that the dollar’s 10% decline throughout 2025 needed to be viewed in context. At the time, it had largely given back its 10% post-election surge at the end of 2024, and a wider lens showed a currency that had spent the prior three years moving within a relatively narrow range.
By the end of 2025, however, the picture looked more complicated. The dollar index had fallen to its lowest level since 2022 and moved below 100 on a sustained basis, leading many investors to argue that the long bull cycle in the dollar may have ended. That naturally raised questions about whether portfolios should tilt more meaningfully toward foreign currencies or alternatives such as gold.
Then the conflict in the Middle East disrupted that narrative. Conventional wisdom might have suggested that gold would serve as the primary safe haven amid rising geopolitical tensions. Instead, the U.S. dollar index quickly moved back above 100, while gold suffered a peak-to-trough decline of roughly 25% from March 1 to March 23.
That reversal is a useful reminder of why we are cautious about acting on currency forecasts. Inflection points can happen quickly, the catalysts are inherently unpredictable, and the cost of positioning too aggressively around a single macro view can be meaningful.
More broadly, the pattern we described last quarter still appears intact. Over the past fifteen years, the dollar has often spent long stretches consolidating within broad ranges before breaking to a new level when a sufficiently strong catalyst emerged. Where it goes from here will depend on variables such as geopolitics, Federal Reserve policy, and global capital flows, none of which can be forecast with enough precision to anchor portfolio decisions confidently.
Our goal is to build portfolios that do not depend on getting the next move in the dollar right. By diversifying across U.S. and international markets, currency fluctuations become part of the investment landscape rather than the primary driver of success or failure.
Data Disclosures: Source: Investing.com
Interest Rates: US Treasury Yield Curve
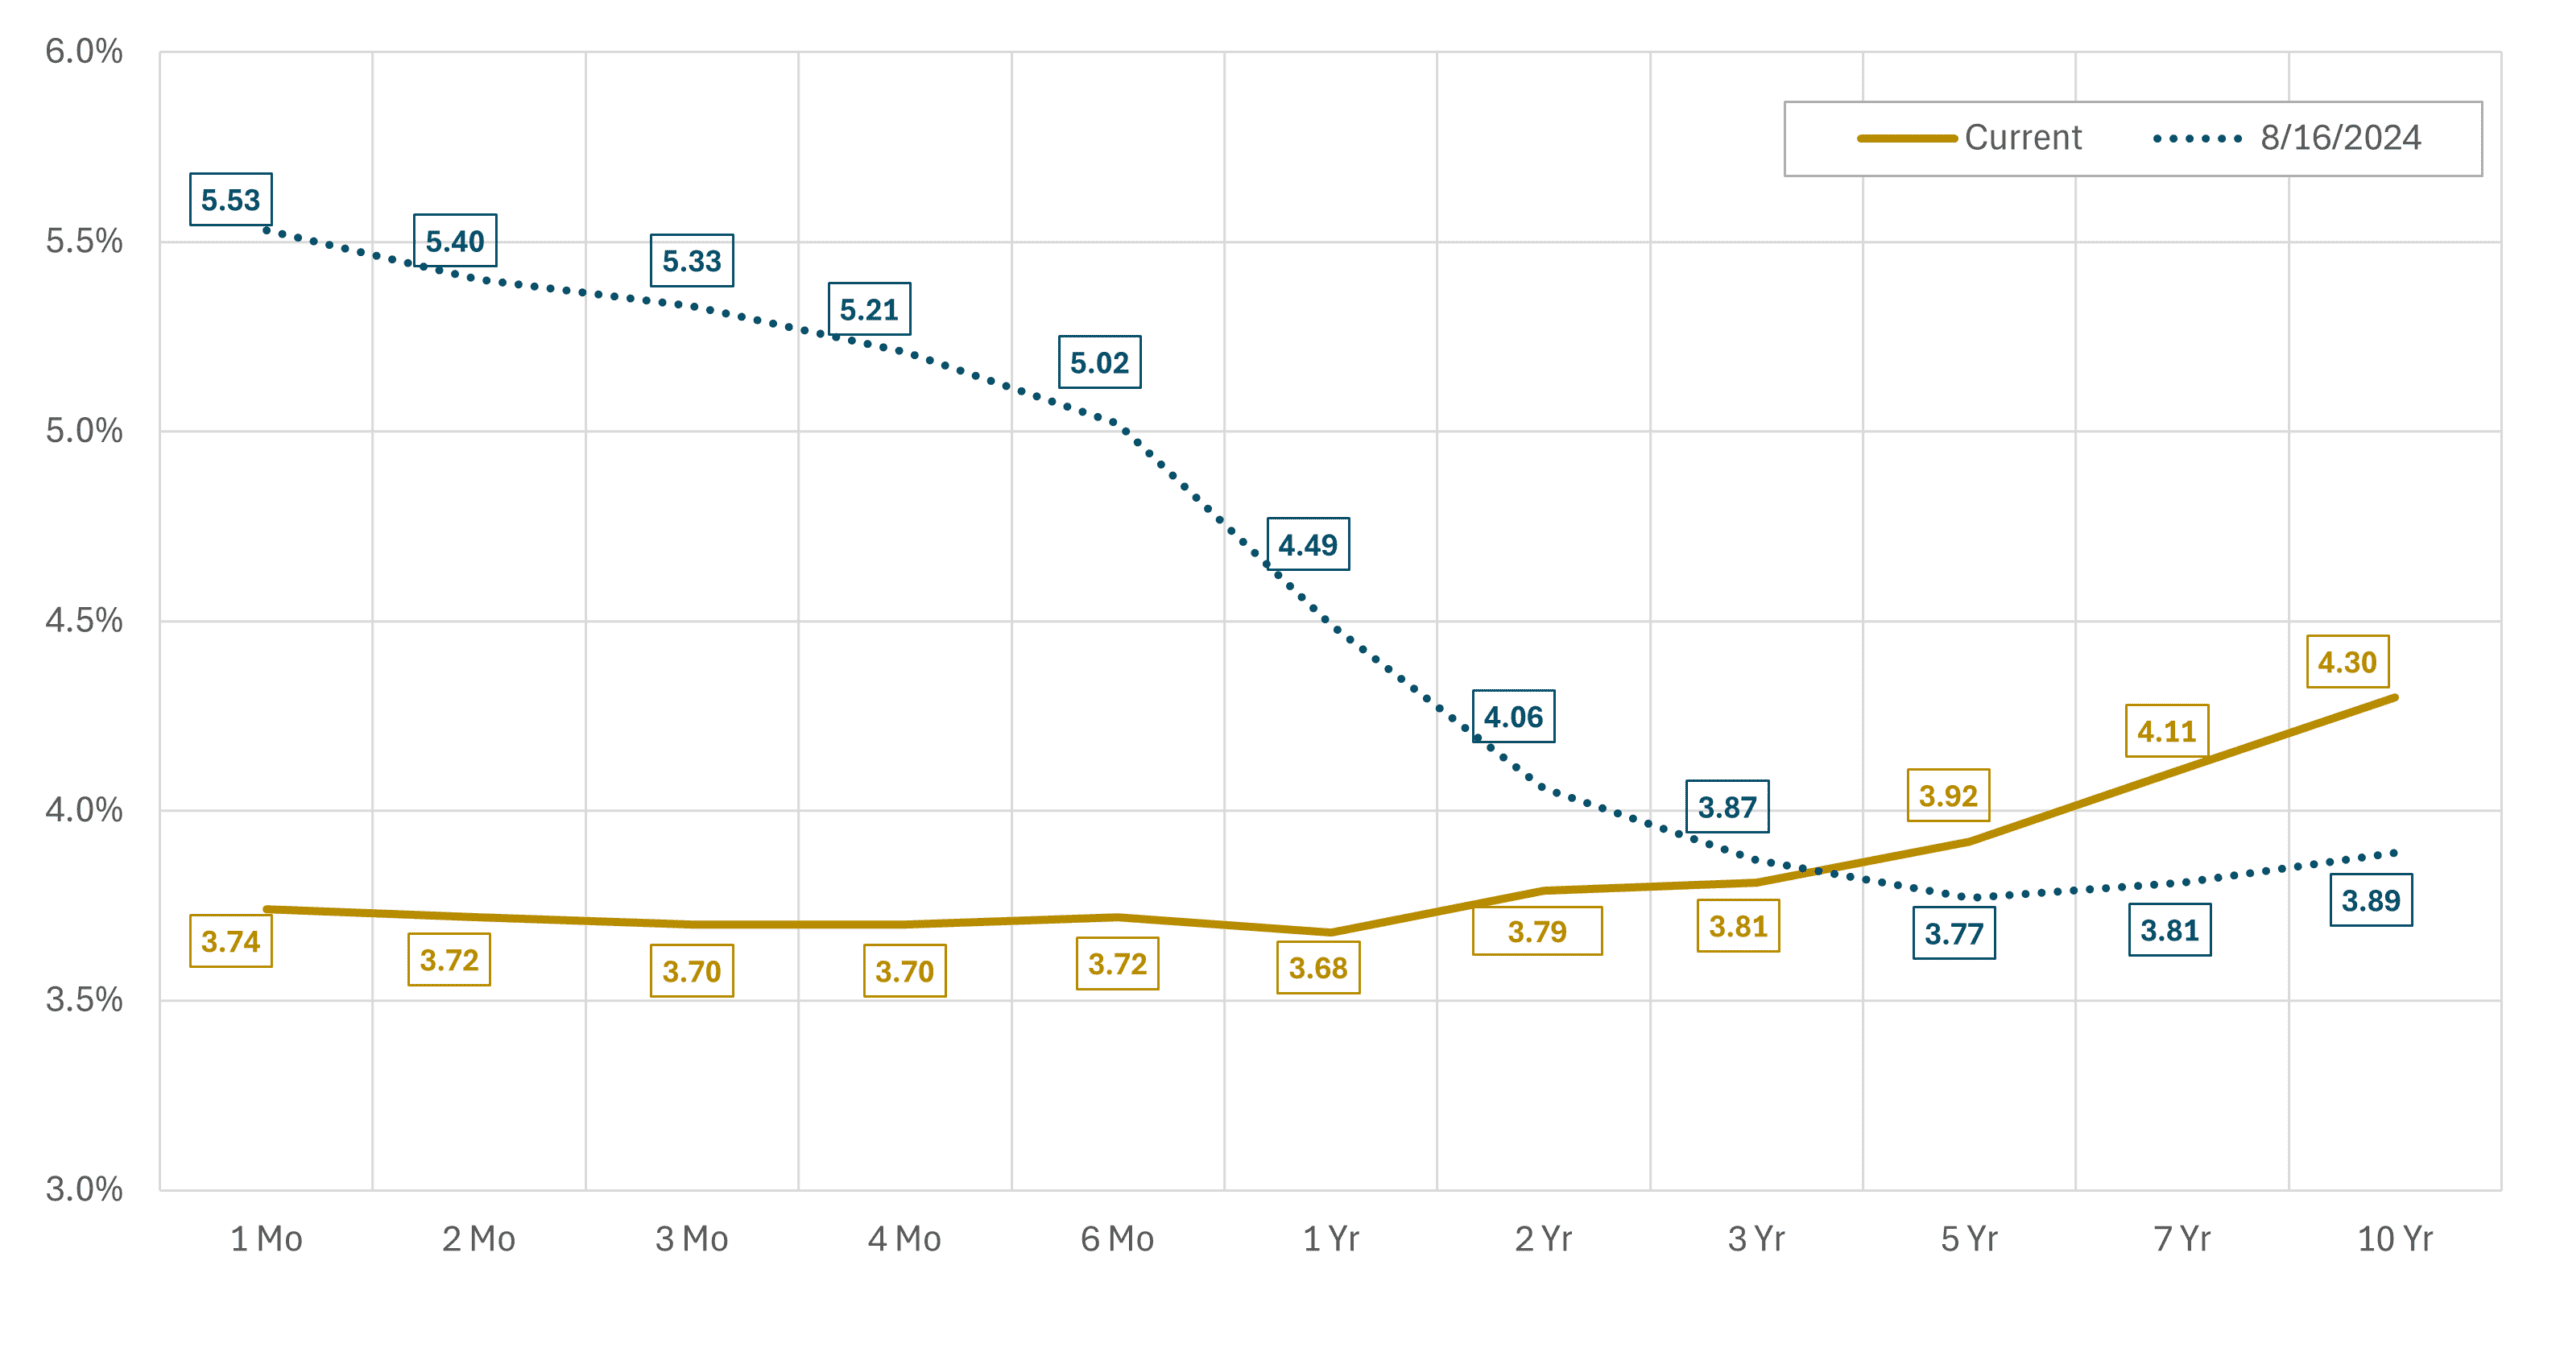
About this chart: This chart shows the treasury yield curve as of 8/16/2024—one month before the first interest rate cut of the current cycle—and 3/31/2025.
Key Takeaways:
In the current interest rate cycle, the Federal Reserve has taken the following actions:
- September 18, 2024 — cut by 50 basis points to 4.75 % – 5.00 %.
- November 7, 2024 — cut by 25 basis points to 4.50 % – 4.75 %.
- December 18, 2024 — cut by 25 basis points to 4.25 % – 4.50 %.
- September 17, 2025 — cut by 25 basis points to 4.00 % – 4.25 %.
- October 29, 2025 — cut by 25 basis points to 3.75 % – 4.00 %.
- December 10, 2025 — cut by 25 basis points to 3.50 % – 3.75%.
In total, the Federal Reserve has reduced the Fed Funds target rate by 175 basis points since September 2024. Yet yields on Treasury securities with maturities beyond five years have risen modestly, reflecting concerns that inflation may prove stubborn and that policy easing will not bring a return to the ultra-low rate environment of the past decade.
The yield curve is considered ‘inverted’ when short-term Treasuries pay more than long-term Treasuries—a rare setup that often reflects recession fears. Over the past year and a half, as the Fed has cut interest rates, the curve has been steadily moving back toward normal, with short-term yields easing and long-term yields staying elevated.
While investors have benefited from unusually high returns on cash in recent years, the yield curve is now relatively flat and moving toward normalization. This creates stronger incentives to move beyond cash to capture attractive income opportunities across the bond market.
Data Disclosures: Source: US Treasury
Market Expectations for Interest Rate Policy

About this chart: This chart is a probability distribution table showing where the market believes the Fed Funds rate will be following upcoming Federal Reserve Interest Rate Policy Meetings, the dates of which are listed in the column on the far left. The probabilities listed in the table are all derived from the prices of Fed Funds Futures Contracts that trade throughout the day. The logic behind the calculations is that the current prices of various Fed Funds Futures Contracts only makes sense if these probabilities correctly reflect investor expectations. Of course, this does not mean investors will be right or the future will unfold according to the expectations investors have today.
Key takeaways:
Prior to the escalating military action in the Middle East, futures markets had been pricing in roughly two interest rate cuts over the course of 2026. The assumption was straightforward: slowing growth and a cooling labor market would give the Federal Reserve room to ease. That expectation abruptly disappeared in March.
As of quarter end, markets were pricing virtually no probability of a cut at any of the next several Fed meetings, with the current 3.50–3.75% rate expected to hold through at least the summer. More striking, futures markets had begun to assign a small but nonzero probability that the next move could be higher rather than lower—something that would have seemed unlikely at the start of the year.
The driver is not complicated. Surging oil prices have reignited inflation concerns, and the Fed cannot cut rates into a fresh inflationary shock without risking its credibility. The situation is also moving quickly and the market’s rate expectations are shifting meaningfully from one week to the next as the conflict evolves.
That said, Federal Reserve officials have been careful not to close the door on cuts entirely. Their commentary has leaned toward patience rather than tightening, acknowledging that if higher energy costs slow the labor market and squeeze consumer spending, the case for easing could return. The Fed is watching two competing risks simultaneously: inflation on one side, growth on the other.
For investors, the practical message is that the rate environment remains genuinely uncertain in a way that makes forecasting difficult. What has not changed is that maintaining diversified fixed income exposure, and avoiding the temptation to time rate moves remains the right posture.
Data Disclosures: Source: CME FedWatch Tool
Inflation Trends
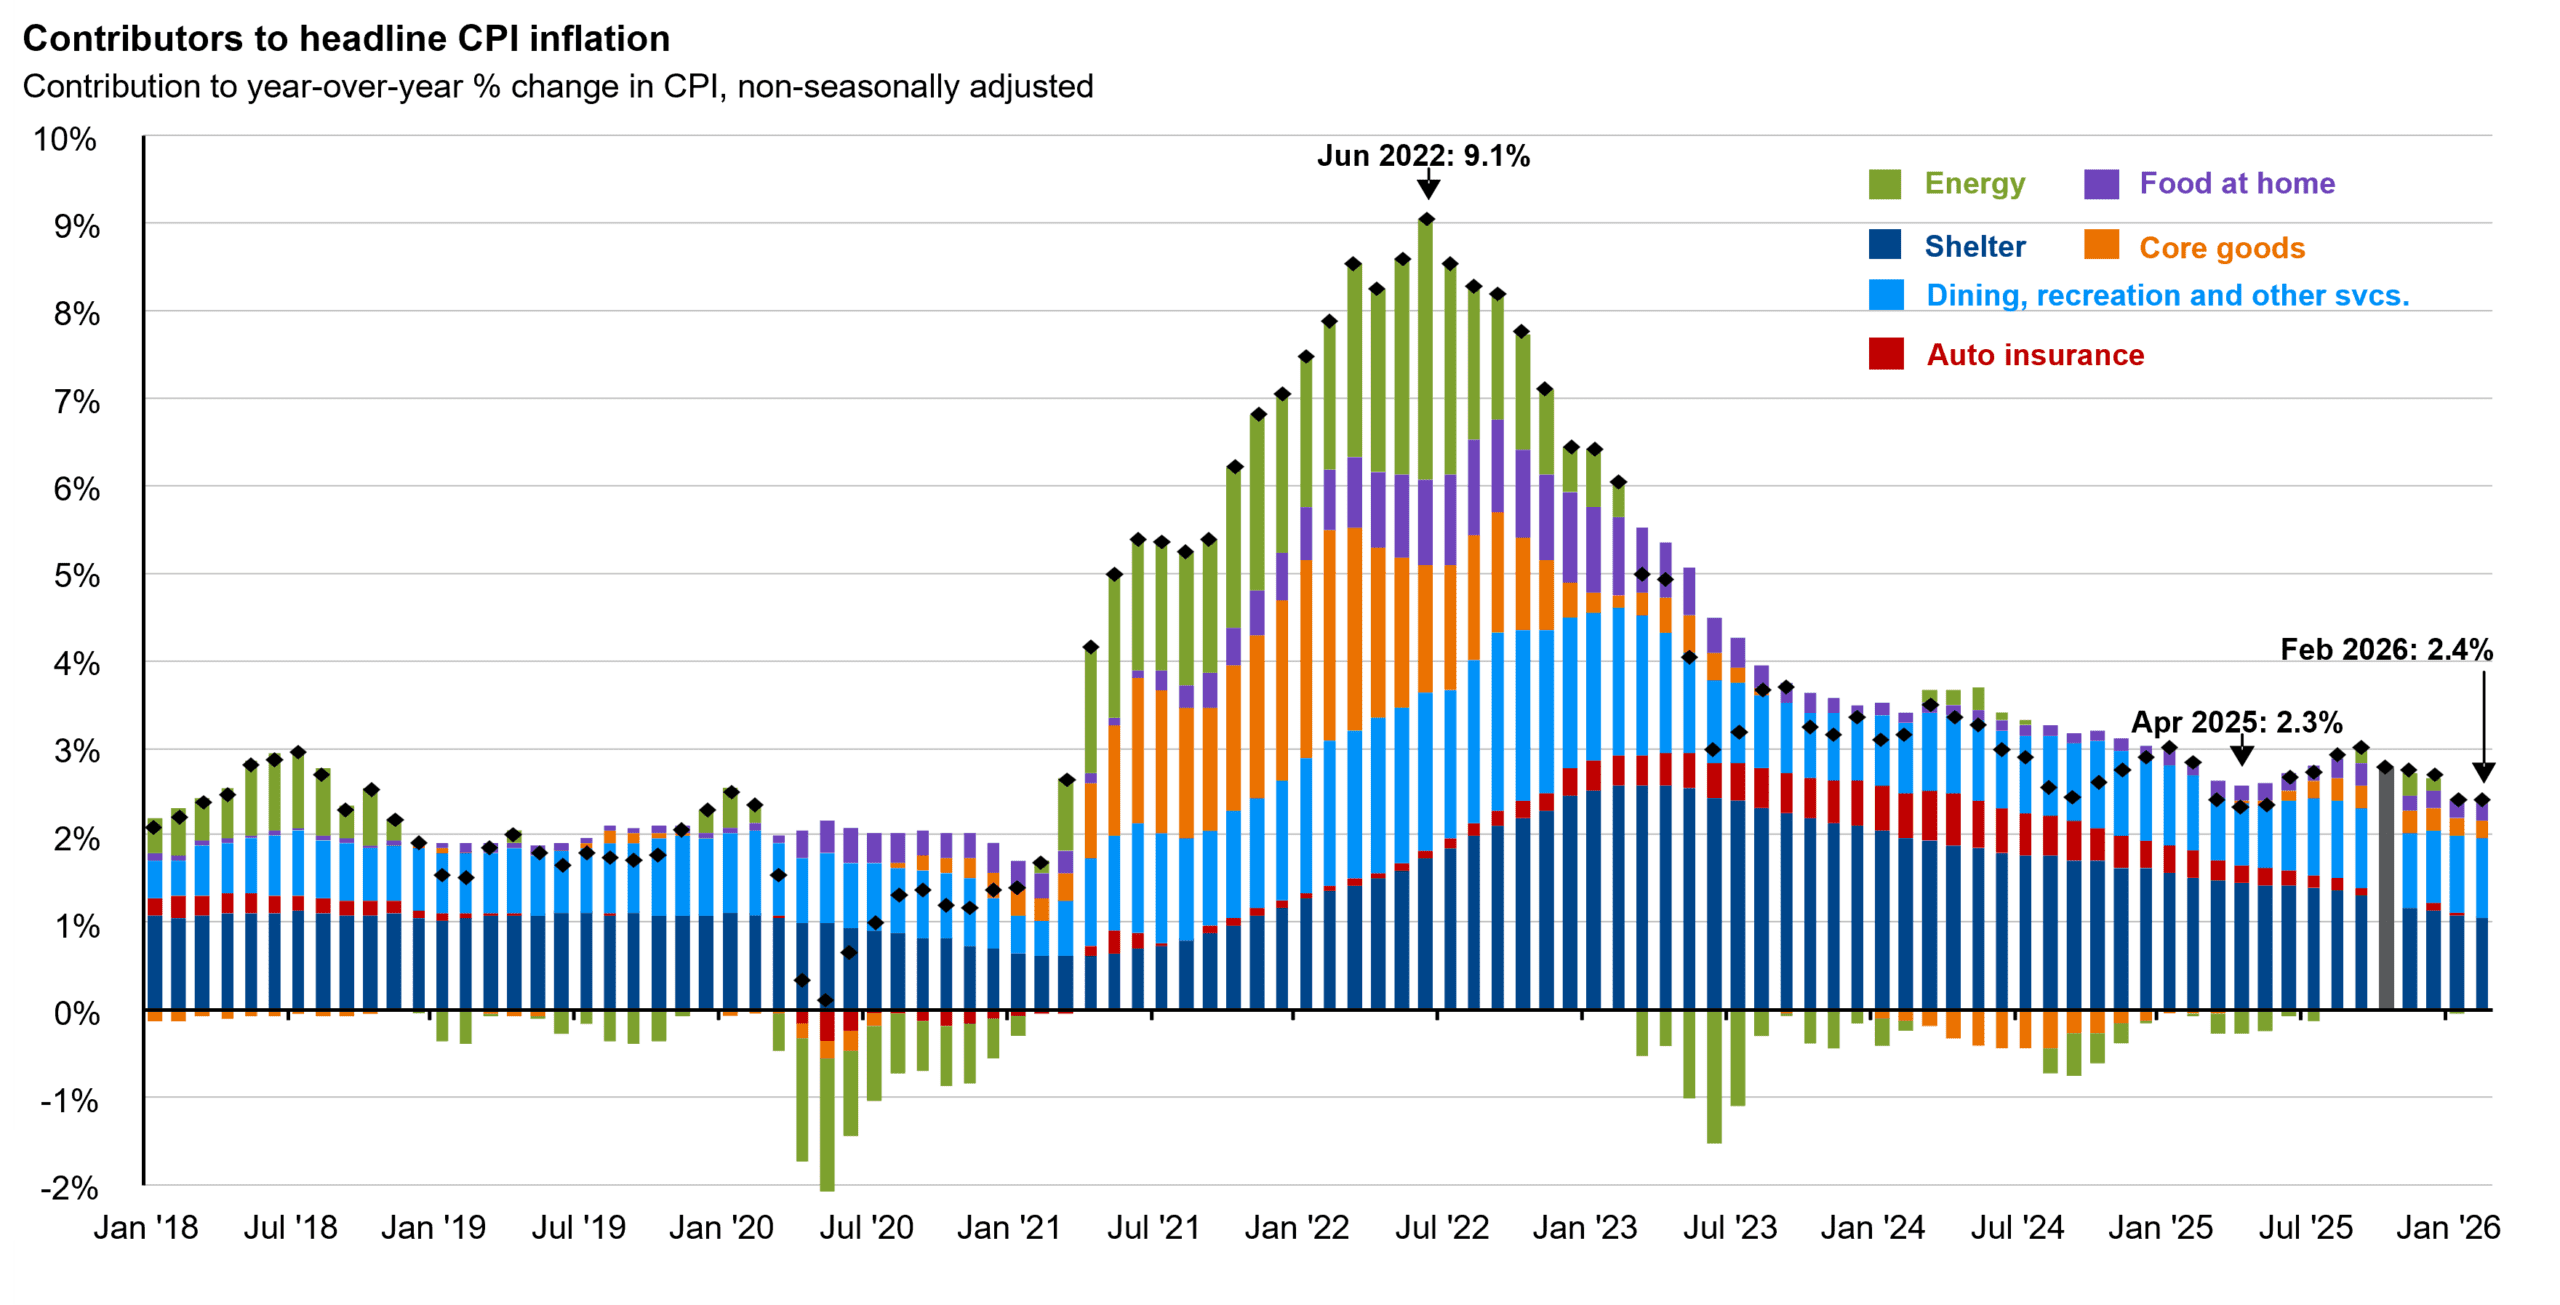
About this Slide: This chart breaks down U.S. consumer price inflation by component, providing a clear view of what has been driving inflation in recent years. Headline inflation peaked in June 2022 due to the Ukraine/Russia war and post-pandemic-related supply issues. Since then, inflation has moderated, and the contributors to inflation have narrowed considerably.
Key takeaways:
Elevated inflation has been an ongoing concern for consumers and a key driver of investment returns across both fixed income and equity markets since 2022. The chart above tells that story clearly. Headline CPI peaked at 9.1% in June 2022, driven by a combination of surging energy prices, supply chain-driven goods inflation, and shelter costs that proved slow to unwind. The journey back down has taken three years and is not quite finished.
The most recent reading of 2.4% in February represents real progress. Core goods prices have largely normalized, and shelter inflation, while still elevated, has been gradually easing. But underneath that relatively calm headline number, inflation was already showing signs of stubbornness before the conflict in the Middle East changed the picture. Services prices remained sticky, tariff pass-through was beginning to show up in select categories, and the underlying pace of price increases had been running above 3% on a three-month annualized basis.
The outlook from here is genuinely uncertain. Surging energy prices will show up in the months ahead, and tariff costs are still working their way through supply chains. The February reading of 2.4% may prove to be the low point for a while. The Federal Reserve is watching both risks carefully, which is precisely why the rate cut expectations described on the prior slide disappeared in March.
Data Disclosures: Source: U.S. Bureau of Labor Statistics, JP Morgan
Calibrating Portfolio Positioning
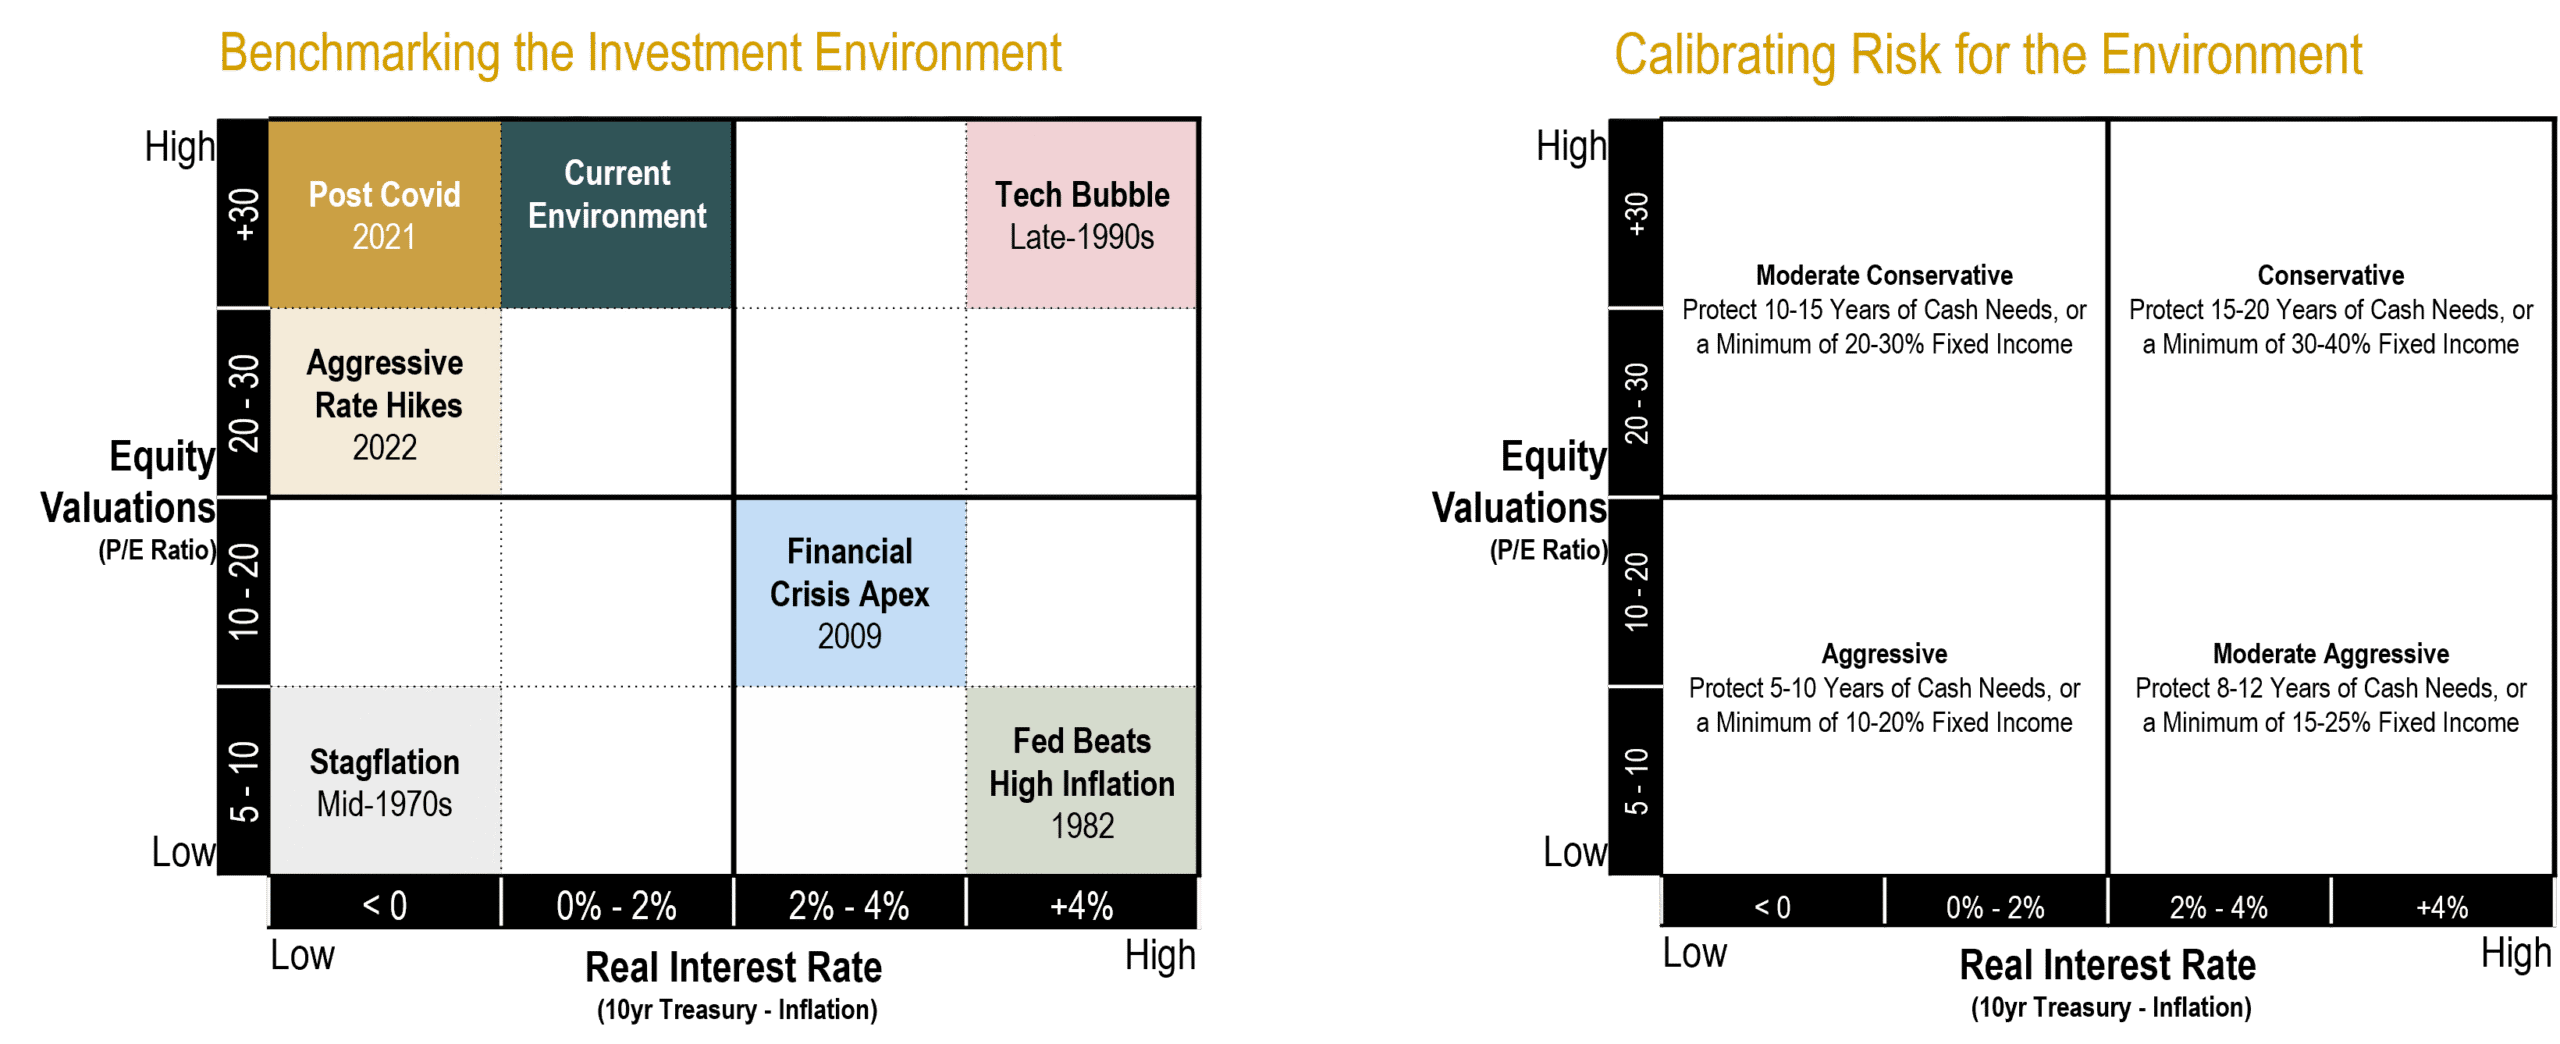
We use the above framework to calibrate our portfolio positioning based on the relative attractiveness of stocks and bonds. The two primary inputs are equity valuations and real interest rates.
Historically, starting equity valuations have shown an inverse relationship with long-term future equity returns: lower starting valuations have generally led to better forward returns, while higher starting valuations have generally led to lower forward returns. In fixed income, starting yields exhibit a strong positive relationship with future returns, especially for bonds held to maturity or over a meaningful portion of their term.
The chart on the left shows how we classify the investment environment using these two variables. The chart on the right shows the broad portfolio posture that would typically align with each environment. Lower valuations generally make equities more attractive. Higher real yields generally make fixed income more attractive.
This framework is meant to guide judgment, not drive mechanical changes. We consider portfolio adjustments only when the relative tradeoff between stocks and bonds shifts meaningfully not simply when the absolute return outlook for each asset class changes on its own. Higher bond yields and lower equity valuations do not automatically call for a repositioning if both asset classes have improved by a similar degree.
For the past several years, the environment has generally fallen in the upper-left portion of the framework: elevated equity valuations alongside low-to-moderate real interest rates. That argues for a moderately growth-oriented posture with a meaningful allocation to fixed income across both high-quality and higher-yielding segments, which is where we have remained.
One important nuance on valuations: today, expensive headline index valuations are heavily influenced by a narrow group of mega-cap growth stocks. Beneath the surface, the return prospects for value-oriented, profitable, and smaller-capitalization companies look considerably more attractive. We are more constructive on the forward return potential of our globally diversified equity portfolios than a simple look at S&P 500 valuations would suggest.
Disclosure: This content is for informational and educational purposes only and should not be construed as individualized advice. For individualized advice tailored to your specific circumstances, please consult with your adviser.
Please remember that past performance may not be indicative of future results. Different types of investments involve varying degrees of risk, and there can be no assurance that the future performance of any specific investment, investment strategy, or product (including the investments and/or investment strategies recommended or undertaken by Brighton Jones, LLC), or any non-investment related content, made reference to directly or indirectly on this website will be profitable, equal any corresponding indicated historical performance level(s), be suitable for your portfolio or individual situation, or prove successful. Due to various factors, including changing market conditions and/or applicable laws, this content may no longer be reflective of current opinions or positions. Moreover, you should not assume that any discussion or information contained on this website serves as the receipt of, or as a substitute for, personalized investment advice from Brighton Jones, LLC. To the extent that you have any questions regarding the applicability of any specific issue discussed above to your individual situation, you are encouraged to consult with a professional advisor of your choosing. Brighton Jones, LLC is neither a law firm nor a certified public accounting firm, and no portion of this content should be construed as legal or accounting advice. A copy of our current written disclosure statement discussing our advisory services and fees continues to remain available upon request.