Bond Basics
With interest rates likely to rise from their historically low levels, fixed-income investors will be assaulted with persistent fearmongering in the years ahead. To help you refrain from acting in response to sensationalized headlines, we thought it would be helpful to arm you with an understanding of bond basics and how fixed-income securities work, in addition to providing you with a historical background of fixed-income performance.
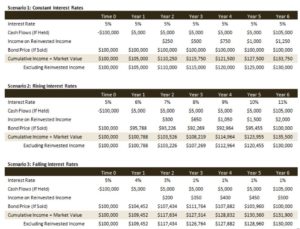
To illustrate how bonds work, we have outlined three scenarios below. In each case, we assume that an investor purchases a bond for $100,000 with an interest rate of 5%. At Time 0, the investor will have a negative cash flow of $100,000 but will take ownership of a bond worth the equivalent amount. In the next 6 years, the investor will receive $5,000 in interest payments and the $100,000 par value back in the final year. We assume the investor takes each $5,000 interest payment and reinvests in new bonds at prevailing interest rates. We calculate the growth of wealth as the cumulative income earned plus the bond’s current market value.
The three scenarios illustrate the impact on cash flows, the market value of the bond, and the growth of wealth during periods when interest rates (1) remain constant, (2) when they rise, and (3) when they fall:
Let us review the key takeaways:
- In all three scenarios, the cumulative income plus market value in year 6 (excluding income on reinvested income) was $130,000 regardless of interest rate movements. This is because fixed-income cash flows are contractual, with the timing and amounts specified in advance.
- Considering interest earned on reinvested income, the investor yielded the highest return in the rising interest rate scenario (because the income was reinvested at a higher rate).
- In the rising interest rate scenario, the bond price initially fell below its $100,000 par value, but it subsequently made up for the loss and was redeemed at par in year 6 (despite interest rates continuing to rise at 1% per year).
- In the falling interest rate scenario, the bond price initially rose above its $100,000 par value but subsequently gave up its gains and redeemed at par in year 6.
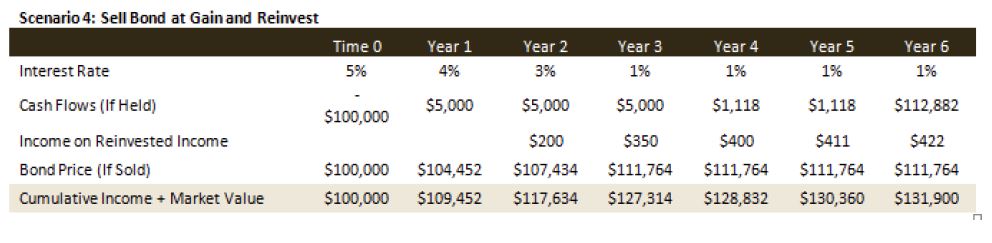
- In Scenario 3, an investor could not benefit economically by selling the bond at a gain before maturity while reinvesting the proceeds in a different bond that still matured in Year 6 (and carried the same credit rating). Here is the math to prove it: If an investor sold the appreciated bond for $111,764 in year 3 and reinvested the proceeds at the prevailing interest rate of 1%, the annual payment would drop from $5,000 to $1,118. Remember, instead of receiving $100,000 back in year 6, the investor would receive $111,764. When adding up the income, the reinvested income, and the principal repayment, we end up with $131,900 in both cases. However, if we factored in commissions, transaction costs, and taxes, the investor in scenario three would be better off than in scenario 4.
The key takeaway is that bonds are not like stocks—bonds are contractual obligations with specified cash flows. In a Brighton Jones portfolio, our cash needs analysis enables us to match the approximate timing and amounts of expected cash needs with the maturities of our fixed income holdings so as to (1) mitigate as much as possible the risk of having to sell a fixed income security when prices move lower, and (2) earn as high of a return as possible while controlling for this risk.
Fearmongering
Most investors have likely come across an article or two noting the recent “bond market collapse” while citing that some investors have taken a double-digit haircut on their fixed-income holdings. Even though the average maturity of outstanding US Treasury securities is around 5 years, many in the media opt to report the performance of 20+ year Treasuries because they are substantially more volatile than an index comprised of all Treasury securities (thus allowing for the use of sensational headlines to draw attention).
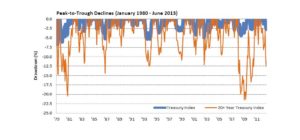
Take the following illustration, for example, which shows periodic peak-to-trough declines of a capitalization-weighted index comprised of all outstanding Treasuries (blue) versus an index comprised of only 20+ year Treasuries (orange) going back to 1980. As you can see, both market segments regularly experience pullbacks comparable to what we just experienced in the second quarter. Still, the longer-term treasuries fell significantly more than the aggregate treasury index. While nobody likes to see losses, recent performance is hardly unprecedented and does not resemble a total collapse of the bond complex.
The key takeaway is that the performance of your portfolio of fixed-income securities likely does not resemble what is being reported by the media unless you own primarily long-term bonds. Revisiting Scenario 2 from Bond Mechanics, note that interest rates rose from 5% to 11% yet the market value of the bond did not fall by more than ~7% while the cumulative income plus market value did not fall below the initial par value of $100,000. Over the long-term, fixed income returns come from income—and reinvestment of income—not price fluctuations, which ultimately net out at zero.
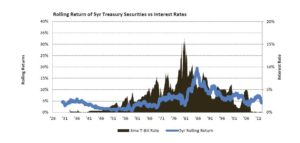
Returns Follow Yields
In Bond Mechanics, we illustrated that rising yields initially impair bond prices (moderately), but ultimately lead to higher ending wealth. To provide a longer-term perspective using real market data, we plot below the 5-year rolling return of 5-year Treasury bonds (blue line) against short-term interest rates (brown area). In doing so, we can see that fixed-income returns follow yields. That is, after interest rates rise (1981), returns on fixed-income securities follow suit (1986), and vice versa. This chart also shows that 5-year Treasury bonds have never had a negative return when held for 5 years! So long as you match your investment time horizon with the maturity of your bond(s), as diversified fixed-income investors, you should not fear price fluctuations or rising interest rates.