What You Need to Know About Inflation
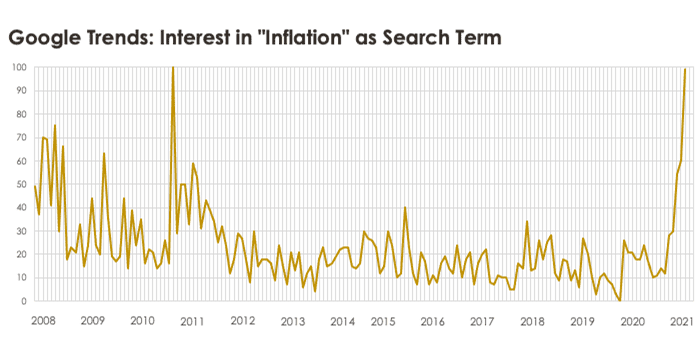
Over the past month, the frequency of client questions relating to inflation has picked up considerably. Indeed, investor concerns about inflation does not appear to be unique to our client base. Google Trends is also showing a marked spike in keyword searches for the term “inflation”:
In this article, we will recap what’s important to know about the recent inflation readings and explain how we account for inflation in our investment strategy and long-term planning analyses.
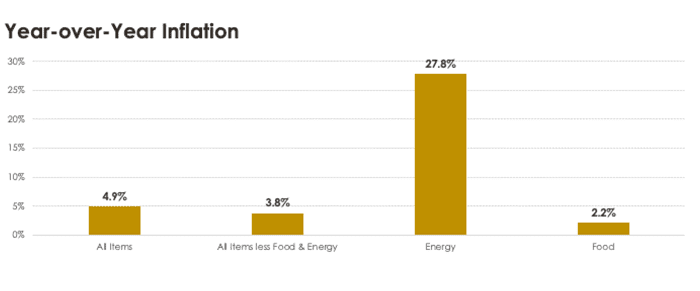
Year-over-year inflation for “all items” measured 4.9 percent in May on a seasonally-adjusted basis. “Core” inflation, which excludes the more volatile food and energy categories, measured 3.8 percent on a seasonally-adjusted basis.
During our quarterly investment webinar in April, we warned that upcoming inflation numbers could reach the 4 percent range. We further warned that media outlets would likely jump on the opportunity to incite fear with scary headlines (so you feel compelled to read more articles about it) as inflation readings jumped.
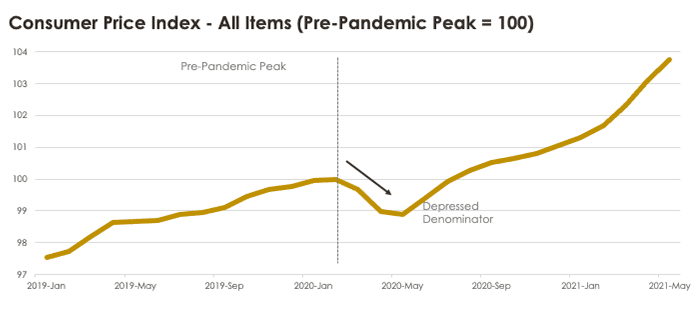
So, how did we know this would happen? It’s simple! We already knew what inflation had been for eleven of the twelve months required to calculate inflation from April 2020 to April 2021 and for ten of the twelve months required to calculate inflation from May 2020 to May 2021. Moreover, we knew price levels had dropped at the onset of the pandemic, so the denominator in the calculation (new price level/old price level) would be moving lower while the numerator ticked higher (see chart below).
While year-over-year inflation for all items measured 4.9 percent, the price level is about 3.8 percent higher from the pre-pandemic peak set in February 2020. As the denominator will begin to move higher instead of lower going forward, we should see the year-over-year inflation moderate. That is partially why the Federal Reserve is suggesting that currently high inflation readings are “transitory.”
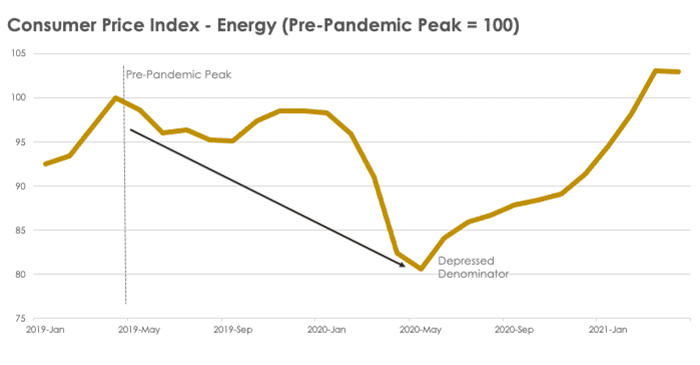
Energy-related inflation looked especially concerning, but price levels from a year ago were severely depressed (you may recall how oil futures prices turned negative for the first time ever). Energy costs peaked in April 2019, slumped 20 percent over the following year, and are now about 7.3 percent higher than the pre-pandemic peak from two years ago.
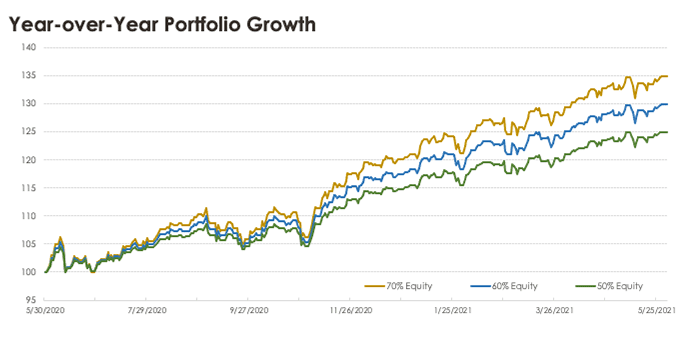
The growth of investment portfolios has significantly outpaced inflation over the past year. Our asset allocation strategy with 60 percent equity exposure was up ~30 percent for the 12-month period ending May 31, far outpacing inflation. All else equal, broadly diversified investors are likely to have significantly more purchasing power today than a year ago.
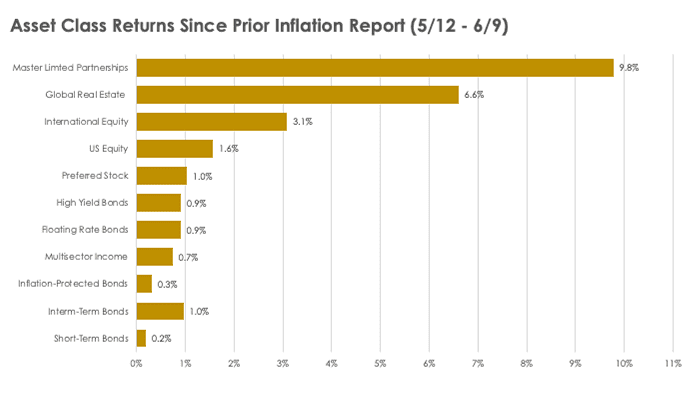
Concerns about a potential spike in inflation became top of mind for many investors after the April inflation report was released on May 12. Since that time, every broad asset class within our portfolios has posted positive returns, with Master Limited Partnerships (+9.8 percent), Global Real Estate (+6.6 percent), and International Equity (+3.1 percent) leading the way. Despite the ominous headlines, diversified portfolios have been resilient.
Our portfolios are structured to perform well across a wide range of economic outcomes, including higher than expected inflation. Here is how we think about it:
By way of background, prices of financial securities incorporate expectations about a wide range of variables, with economic growth and inflation being the two most influential. Economic growth is important because it affects corporate earnings, while inflation is important because it influences interest rate policy.
Whether a particular market segment performs better or worse than expected in the future will be closely linked to whether economic growth and inflation turn out to be higher or lower than expected because these two variables influence the key drivers of investment returns—corporate earnings and interest rates.
In the quadrant chart below, we illustrate how an expanded opportunity set of asset classes (beyond nominal government bonds and global equities) can help us achieve more consistent performance across a wider range of economic outcomes, including higher than expected inflation.
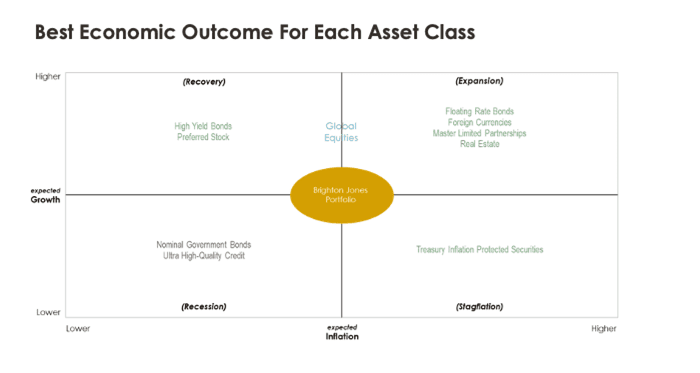
Consider a few examples:
- Periods of weaker-than-expected growth and stronger-than-expected inflation might lead to higher interest rates and declining corporate earnings. To hedge an outcome that might be unfavorable for nominal government bonds, corporate bonds, and equities, we allocate to Treasury inflation-protected securities.
- Year-to-date, inflation-protected bonds are outperforming the total bond market index by 3.06 percent (as of June 9).
- Periods of stronger-than-expected growth and inflation may result in interest rate hikes, which could be harmful to the performance of nominal government bonds. To hedge this risk, we allocate to floating rate bonds, which benefit not only from rising interest rates, but also from stronger corporate profitability.
- Year-to-date, floating-rate bonds are outperforming the total bond market index by 5.5 percent (as of June 9).
- Investments in real estate and master limited partnerships can also serve as inflation hedges due to the nature in which they earn revenue. In an inflationary environment, owners of real estate assets may be able to renew expiring leases at higher rental rates, while master limited partnerships operate “toll road” business models that adjust tariff rates on an annual basis in accordance with rising price levels.
- Year-to-date (as of June 9), MLPs (+50 percent) and global REITs (+20 percent) are the two best performing market segments within our global equity portfolio (the global stock market is up 12.2 percent by comparison).
For the purpose of testing the long-term sustainability of client portfolios, we generally model expenses inflating at 3.5 percent per year. Inflation has averaged about 3 percent since 1926 and 2 percent since 2000, suggesting that we can “absorb” higher than normal inflation without affecting our clients’ long-term planning.
To preemptively address potential concerns with near-term inflation readings, we fully expect to encounter periods where inflation runs above the 3.5 percent target. But we also expect to encounter periods where inflation runs below the 3.5 percent target. We do not expect to change our long-range planning assumption of 3.5 percent inflation based on one or two readings.