What to Expect When You’re Expecting Returns
Portfolio diversification is one of the most fundamental and important tenets of modern finance. Because every company (e.g. MSFT), sector (e.g. technology), region (e.g. Japan), and asset class (e.g. stocks) is susceptible to periods of poor performance that can unexpectedly last for a decade or longer, it is important to maintain a balanced investment approach with exposure to multiple sources of return. For the long-term investor, a heavy concentration in any particular market segment may threaten the ability of a portfolio to satisfy its performance objectives.
To illustrate the benefits of diversification, we often turn to the Periodic Table of Calendar Year Investment Returns.1 To create this illustration, we sort calendar year returns for a range of asset classes from high to low and we color-code each market segment to enable easy visual tracking over time. We also include the performance of a hypothetical moderate-risk portfolio diversified among the various asset classes and rebalanced at the beginning of each year.
Click the image below to view a larger version of the table.
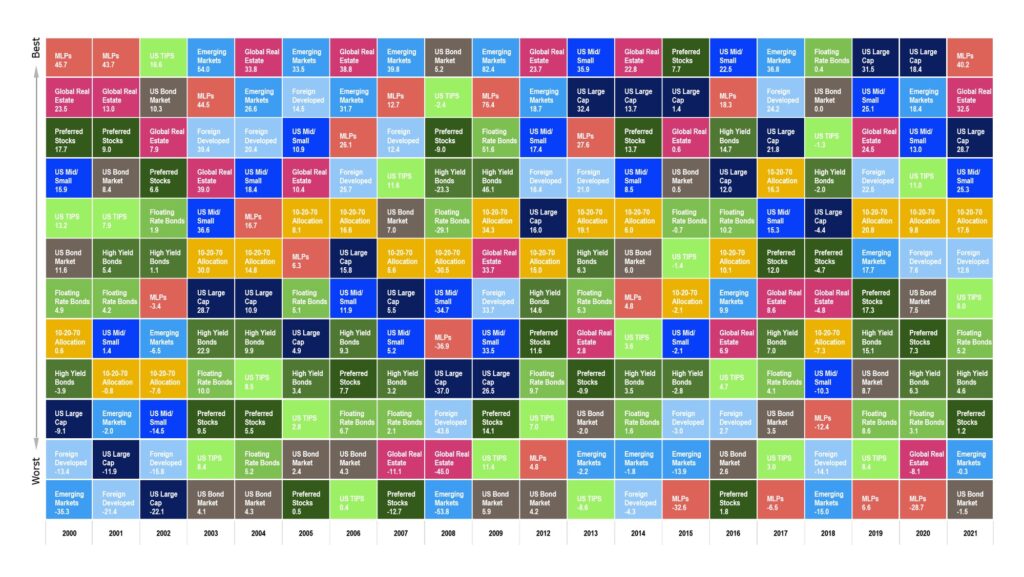
The takeaway from this illustration is simple: some underperforming asset classes continue to underperform, while others rise to the top. Conversely, some outperforming asset classes continue to outperform, while others fall to the bottom. Said differently, the unfortunate conclusion is that one cannot create a rule using past performance to reliably identify in advance which asset classes will be the best (or worst) performers in any given year.
Read more: What to Expect When You’re Expecting Returns, Part II
So, what’s an investor to do? The most reliable way for investors to generate the returns required to meet their financial objectives is to diversify both among and within asset classes so as to neutralize the unpredictable fortunes of individual companies, sectors, countries, and asset types. The real opportunity to achieve superior results lies not in scrambling to guess which market segment might outperform in the year ahead, but in establishing and adhering to appropriate investment policies that enable us to benefit from the key long-term forces in capital markets.
For the long-term investor, a heavy concentration in any particular market segment may threaten the ability of a portfolio to satisfy its performance objectives.
While most investors intuitively understand they should not place all of their eggs in one basket, holding a globally diversified investment portfolio also comes with challenges. Because some part of a broadly diversified portfolio will always produce disappointing results, some behavioral economists quip that diversification is the strategy of maximum regret. Indeed, the biggest challenge facing investors is neither visible nor measurable; it is hidden in the emotional weaknesses we all possess as investors. For the diversified investor, the challenge is overcoming the conflicting feelings we are sure to encounter when retaining and potentially adding to assets after periods of disappointing performance, despite the documented benefits of doing so over time.
Of course, the key to overcoming unproductive behavioral tendencies is to reduce the potential for surprising outcomes. In teaching ourselves how best to behave as investors, we can learn a great deal by studying the past. While the Periodic Table of Calendar Year Investment Returns reveals the unpredictability of asset class performance from year to year, it does not adequately inform us of the range of outcomes for different asset classes in different market cycles. For this reason, we have modified the periodic table of returns to show cumulative asset class and portfolio returns over multi-year periods.2
Click the image below to view a larger version of the table.
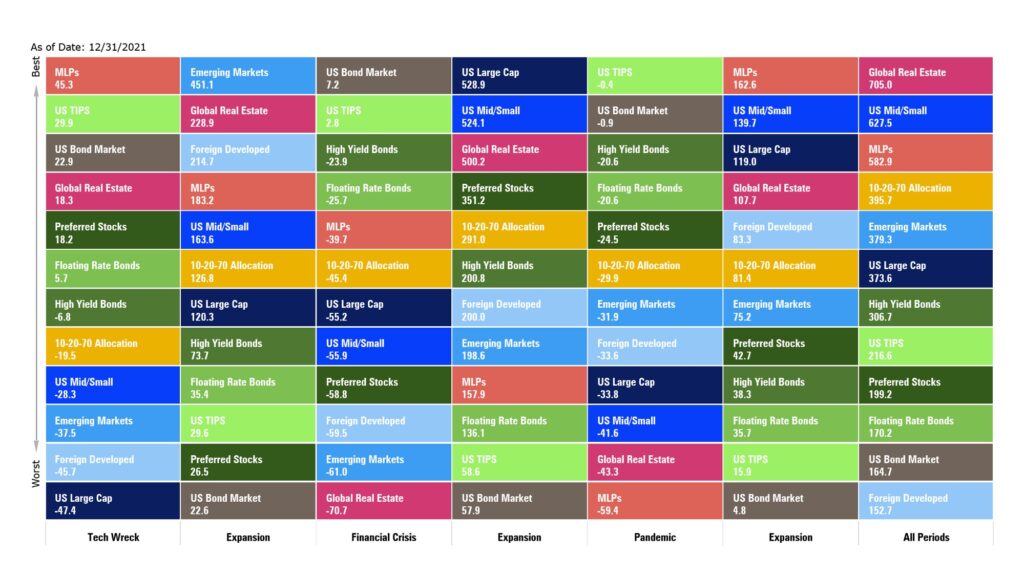
The takeaways from this illustration are many:
- With domestic large cap stocks (S&P 500 Index: +529%) outperforming foreign developed stocks (MSCI World ex US: +200%) in the previous cycle (2009 – 2020), many investors have questioned whether it really makes sense to diversify globally. But in looking at the expansionary period following the tech crash (2003 – 2007), we observe the opposite relationship playing out with foreign developed stocks (+215%) outperforming domestic large cap stocks (+120%). With each market cycle producing different winners and losers on a relative basis, investors who remain globally diversified over the long-term can achieve more consistent performance than any single market segment in isolation.
- It is common for investors to benchmark the performance of a globally diversified investment portfolio against a single equity market index like the S&P 500 but doing so will not provide conclusive evidence of superior or inferior management. During the 2003 – 2007 expansion, the 10|20|70 portfolio generated marginally higher returns than the S&P 500 Index; but this was not due to superior management, nor was it due to luck. It was a mechanical function of portfolio returns being driven higher by exposure to foreign markets. With the opposite scenario playing out in the most recent cycle, investors should not be concerned that a globally diversified portfolio is trailing the high-flying domestic stock market. As we observe over multiple cycles, what comes around eventually goes around.
- Benchmarking a globally diversified portfolio against a single equity market index like the S&P 500 can also create precarious incentives. The manager of a diversified portfolio will look best when the largest portfolio component—domestic stocks—underperforms diversifying asset classes on a relative basis, but the investor is likely to earn a higher absolute return when domestic stocks outperform diversifying asset classes. Would you prefer to have better relative returns versus an arbitrary benchmark like the S&P 500 Index (2003 – 2007) or higher absolute returns (2009 – 2020)? It is important to remember that a portfolio designed to offer the highest probability of outperforming the S&P 500 Index is not the same as a portfolio structured to offer the highest probability of meeting one’s planning objectives.
- The 10|20|70 portfolio had positive cumulative returns of +1508% during the three up periods and negative cumulative returns of -69% during the three down periods. The U.S. Stock Market had positive cumulative returns of +2934% during the three up periods and negative cumulative returns of -84% during the three down periods. Over the entire period, the diversified portfolio slightly outperformed the US Stock Market on a cumulative basis. When compounding investment returns over multiple up-down cycles, broadly diversified investors do not need to capture 100% of the upside if they are better protected on the downside.
Investing successfully over a lifetime does not require a stratospheric IQ, unusual business insights, or inside information. What’s needed is a sound intellectual framework for making decisions and the ability to keep emotions from corroding that framework.
This may sound simple enough, but the measured views of a diversified investor will face ongoing pressures from a wide range of individuals. Friends and family will inevitably share their supposed successes investing in the latest concoction developed by Wall Street engineers (while neglecting to mention any failures). Large brokerages will urge the sale of yesterday’s losers and the purchase of today’s hot prospects. The media will continually push a dramatically divergent worldview and proclaim that a new paradigm is on the horizon. But, it is important to remember that a broadly diversified investment strategy would have fared admirably over the past two decades (despite enduring two of the three worst bear markets in modern financial history), and there is no reason to believe the future will turn out differently.
1 Moderate Portfolio (30% capital preservation): 30% US Bonds, 19.1% S&P 500, 12.75% Small/Mid, 13.72% World ex US, 2.625% High Yield, 3.15% TIPS, 3.43% Emerging Mkts, 2.625% Preferreds, 4.2% Global REITS, 3.15% MLPs, 2.625% Leverage Loans. Source: Brighton Jones, Zephyr, Morningstar
2 Moderate Portfolio (30% capital preservation): 30% US Bonds, 19.1% S&P 500, 12.75% Small/Mid, 13.72% World ex US, 2.625% High Yield, 3.15% TIPS, 3.43% Emerging Mkts, 2.625% Preferreds, 4.2% Global REITS, 3.15% MLPs, 2.625% Leverage Loans. Source: Brighton Jones, Zephyr, Morningstar