Preparation Is the Key to Investment Success
If we cannot predict the arrival or impact of events that affect markets, we must rely on a time-tested investment philosophy

The COVID-19 pandemic is a supernova in human history that is certain to have a lasting effect on many aspects of the human condition. For decades to come, experts from a wide range of fields—economics, psychology, sociology, politics, epidemiology, public health, and more—will work to understand how the global response to combat this coronavirus changed the world.
While humanity has endured other seismic and transformational events, few would argue with the assertion that we are now living in unprecedented times. For investors, what does it mean to be living in unprecedented times? Can we still rely on the foundational principles of our investment process to see us through this period of uncertainty? Or, do these unprecedented times call for a new approach to constructing investment portfolios and planning for the future?
Table of Contents
- We Prepare for What We Cannot Predict
- Has Diversification Delivered as Expected?
- Liability-Driven Investing Establishes a Strong Foundation
- Tracking the Recovery
- Conclusion
In this article, we examine how key tenets of our investment philosophy have helped us navigate periods of uncertainty and reaffirm why our approach leaves us well-positioned to deliver favorable outcomes for clients in the years ahead.
I. We Prepare for What We Cannot Predict
Investors hoping to earn outsized returns commit vast amounts of money, time, and effort attempting to forecast economic growth, inflation, interest rates, corporate profits, and other variables that influence the performance of financial securities. But capital markets are also affected by events and crises that originate from outside the economic system.
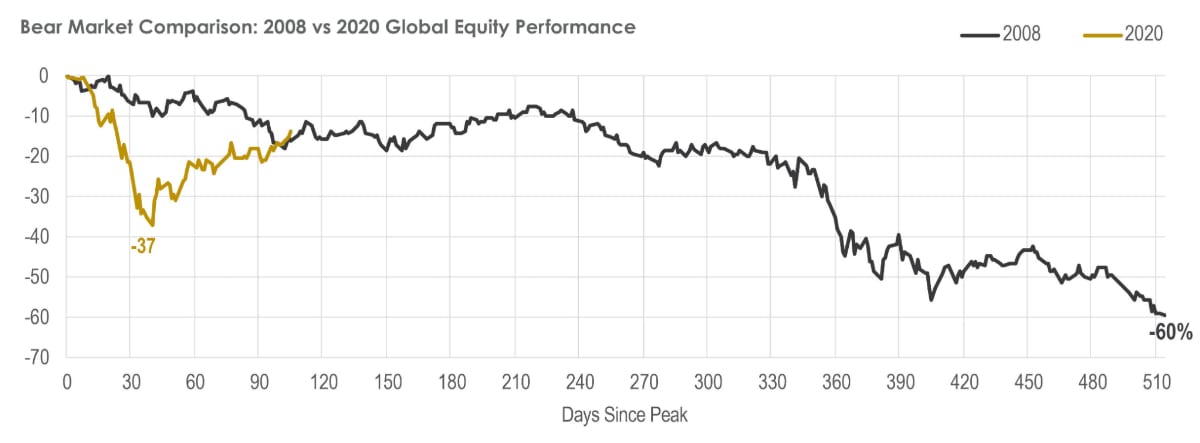
Because exogenous shocks (e.g., natural disasters, wars, pandemics, etc.) often arrive with little warning, they can trigger sharper selloffs in comparison to recessions that are slower to materialize as part of the normal business cycle. As one example, compare global equity market performance during the bear markets of 2008 (economic crisis) and 2020 (health crisis).
As it became increasingly evident in February that COVID-19 would not be contained, global equities retrenched 37 percent in just 33 calendar days, or 23 trading days. It was the fastest decline of 30-plus percent in U.S. stock market history. By comparison, it took 361 calendar days, or 248 trading days, for global equities to decline 37 percent during the 2008 financial crisis.
Takeaway:
Our portfolio construction process revolves around the idea that it is impossible to predict with any degree of precision the catalyst of the next global downturn—it could be a war, a revolution, an earthquake, a recession, an inflation shock, a policy mistake, a pandemic, a terrorist attack, anything. If we cannot predict the arrival or impact of certain types of events that affect capital markets, we must prepare for market volatility—whenever it might occur—through prudent portfolio construction.
This entails diversifying among and within a wide range of asset types whose returns are driven by different economic variables and outcomes while establishing an asset allocation policy that enables us to weather the storms we are sure to encounter in our pursuit of investment returns.
In the following sections, we revisit how our approach to diversifying portfolios and allocating capital has helped us in challenging times.
II. Has Diversification Delivered as Expected?
While we may not be able to predict the catalyst of the next downturn or the impact of an exogenous shock to the economy, we can reasonably predict how different asset types will respond in periods of strong or weak economic growth, high or low inflation, rising or falling interest rates, appreciating or depreciating local currency, and so on.
Understanding the expected behavior of different asset types across a wide range of possible economic outcomes enables us to build resilient portfolios that balance the return objectives and risk capacity of our clients. But a meaningful miscalculation in the expected behavior of different asset types could materially compromise the ability of a portfolio to meet its performance requirements.
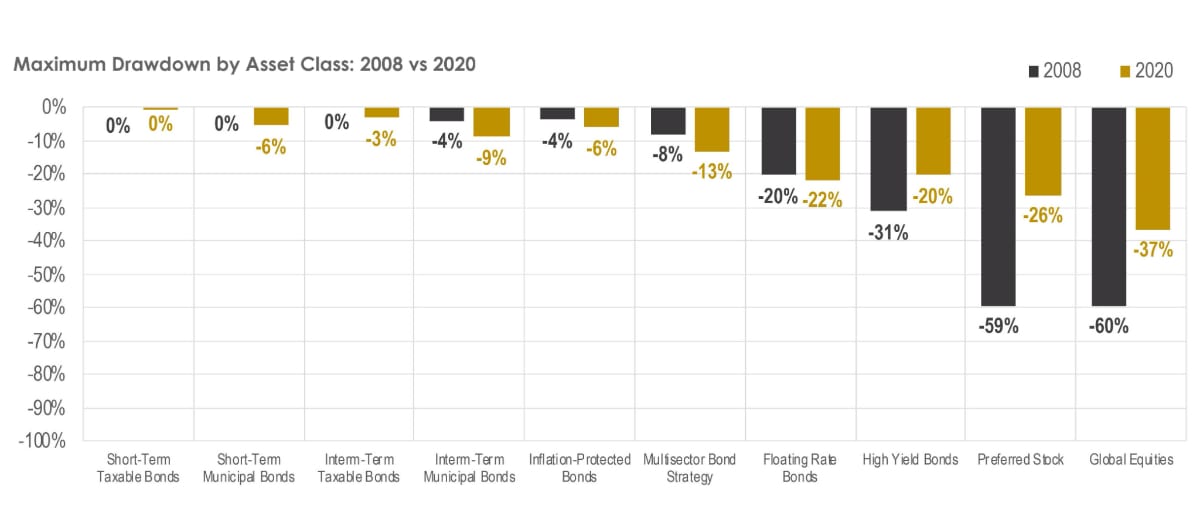
For this reason, it is important to continually assess whether the opportunity set of asset classes in our portfolios perform as expected, especially when adverse outcomes materialize. In the following chart, we compare the maximum drawdowns, or peak to trough declines, sustained by each asset class during the bear markets of 2008 and 2020.
Given the severity and global nature of the 2008 financial crisis, it serves as a useful litmus test for what we might expect across a wide range of asset types, which in turn has provided valuable insights for the purpose of building resilient portfolios.
Observations:
- Moving from left to right across the horizontal axis, the maximum drawdown of each asset class became progressively steeper during both bear market periods. While the absolute numbers differed between 2008 and 2020, the relative relationships align with our expectations.
- During the 2020 drawdown period, high-quality municipal bonds sustained greater declines than previously seen. These losses were quickly recouped, however, as the Federal Reserve and the Treasury Department announced monetary and fiscal relief packages. It is also worth noting that the municipal bond market was coming off a strong year in 2019, so 1-year trailing returns turned only slightly negative for a brief period.
- While Intermediate-Term Taxable Bonds and Inflation-Protected Bonds experienced drawdowns in the current period, the performance of these market segments remained in positive territory for much of the year-to-date period. Hence, the drawdowns largely reflect giving up earlier gains.
- In the 2008 financial crisis, preferred stocks suffered losses comparable to global equities. This was because preferred securities are weighted heavily in the financial sector. We expected that preferred stocks would fare better—as they did recently—in a typical recession or non-financial crisis.
- The average maximum drawdown of publicly-traded strategies within our High Income Portfolio (inflation-protected bonds, multisector-bond strategies, floating-rate bonds, high yield bonds, preferred stocks) was 17 percent in the recent selloff. This represents a 45 percent down capture ratio relative to global equities (which is comparable to 2008) and aligns with our expectations.
- Note: In 2018, we introduced private credit to the opportunity set of asset classes within our High Income Portfolio. The High Income Portfolio inclusive of our private credit strategy experienced a lesser drawdown than shown for strategies in public markets.
Takeaway:
Importantly, each market segment largely performed in line with expectations given the prevailing economic environment. The opportunity set of asset classes enabled conservative investors to reduce their drawdown potential relative to more aggressively allocated investors; and those withdrawing money from their portfolio to fund anticipated cash needs were able to sell positions that were either flat or positive, rather than selling positions that had declined in value.
In constructing portfolios, defining the opportunity set of asset types and arranging them according to their expected behavior is only the first step. Next, we revisit our process for allocating capital across each market segment.
III. Liability-Driven Investing Establishes a Strong Foundation
The key to assuming risk responsibly in pursuit of investment returns is to give each market segment an adequate amount of time to achieve its long-term performance target. This requires that we (1) know the timing and amounts of anticipated cash needs for each client, and (2) determine a minimum holding period for each asset class, understanding that more volatile market segments should be given more time to perform according to expectations.
Putting these two concepts together, our Cash Needs Analysis computes a running total of annual withdrawal needs for each client portfolio, and our Investment Committee sets guidance for how capital is allocated among our Capital Preservation, High Income, and Global Equity portfolios based on optimal holding periods for each category.
Prior to the market peak in February 2020, we aimed to protect the first eight years of anticipated cash needs in Capital Preservation and the next six years in High Income, giving our Global Equity holdings a 15+ year time horizon. In assigning holding period targets, we want to give each bucket enough time to endure a bear market period, recover temporary losses, and then provide a positive return commensurate with our expectations for the asset class.
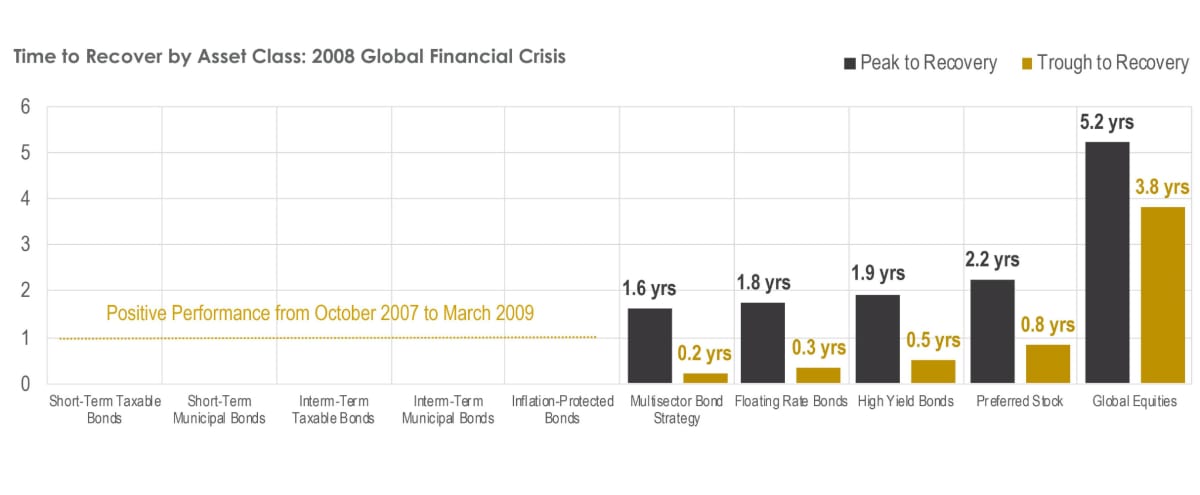
While every recession is different, we can look back to the 2008 financial crisis once again to illustrate why this approach makes sense. In the following chart, Peak to Recovery (brown) measures how long it took to recover losses starting from the October 2007 high, and Trough to Recovery (yellow) measures how long it took to recover losses from the March 2009 low.
While the Peak to Recovery period is more important for establishing holding periods for different market segments, the Trough to Recovery period reveals how quickly opportunities to invest in depressed market segments can evaporate.
Observations:
- Having an allocation to high-quality bonds allowed investors to fund anticipated cash needs from asset classes with positive performance and/or opportunistically rebalance to take advantage of depressed prices in riskier market segments.
- A minimum holding period of nine years for high-income strategies provided ample time for these market segments to recover and deliver attractive returns.
- A minimum holding period of 15+ years for global equities provided ample time to recover losses and deliver returns that outpaced fixed-income holdings.
Takeaway:
Few ideas in the investment world are as widely accepted as the notion that risk and return are positively related—that without accepting higher risk, the possibility of higher return is not available. But it is only when we invest over a sufficiently long period that we begin to see higher risk investments dominate lower-risk investments.
For this reason, we developed a process that customizes each clients’ asset allocation based on the timing and amounts of their anticipated cash needs. It is a process that has enabled us to successfully navigate through the most challenging market environments in the modern era.
IV. Tracking the Recovery
Having endured a sharp drawdown followed by a robust bounce off the bottom, all in the span of three months, you might be wondering how far each market segment has recovered to date.
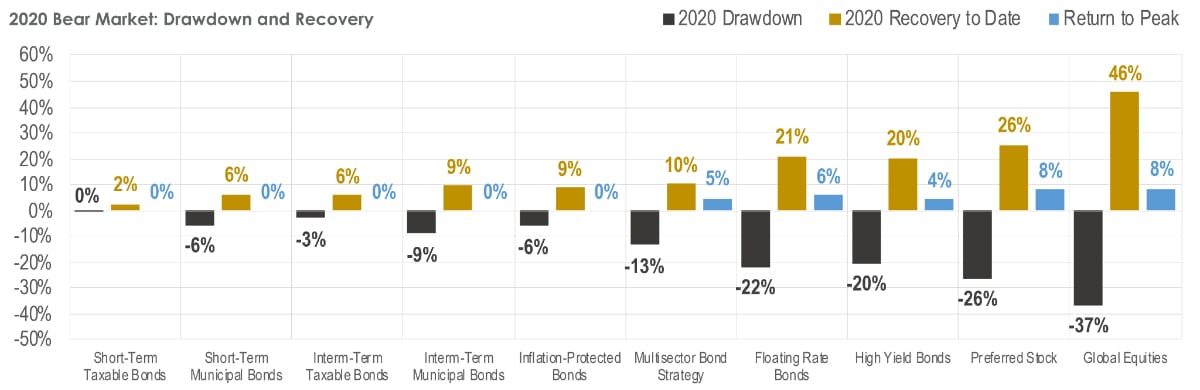
In the chart below, we show the maximum drawdown sustained in each market segment from February 19 to March 23 (brown), the recovery in each market segment from March 23 to June 5 (yellow), and how far each market segment has to go to get back to its high-water mark (blue):
Observations:
- Capital Preservation market segments, including municipal bonds, have positive year-to-date returns.
- The average return of High Income strategies since the March 23 low is approximately 17 percent, achieving a 84 percent retracement of the return required off the bottom to regain the high-water mark.
- Global equities have surged 46 percent since the low, achieving a 78 percent retracement of the return required off the bottom to regain the high-water mark.
Conclusion
The past three months have been nothing short of a roller coaster for financial markets. Initially, investors were shell shocked by the velocity of the selloff in risk assets. They were then surprised and bewildered by the speed and magnitude of the recovery. Needless to say, the past three months have provided ample opportunities for investors to make mistakes.
But, armed with the mindset that we must prepare for what we knowingly cannot predict, our portfolios were well-positioned to endure the downturn and then capture the upswing.
The opportunity set of asset classes in our portfolios included market segments that registered positive performance during the drawdown period, allowing us to meet anticipated cash needs for clients without having to sell positions trading at depressed prices.
And, our liability-driven process for allocating money across our Capital Preservation, High Income, and Global Equity portfolios continues to ensure that we have enough capital invested in high-quality fixed income—even if volatility flares up once again—so our growth-0riented investments will have time to fully recover losses and deliver attractive returns.
Many things in the world today may seem different than a short time ago. Still, we remain confident that our investment philosophy and portfolio construction process will endure, leaving us well-positioned to deliver favorable outcomes for clients in the years ahead.
Read more from our blog: