Why Savvy Investors Avoid the Temptation of Trends
For the past several years, thematic investing has been a hot topic. Generally, it means buying stocks or other investments that benefit from a particular trend such as remote work, initial public offerings, space exploration, cloud computing, blockchain, etc.
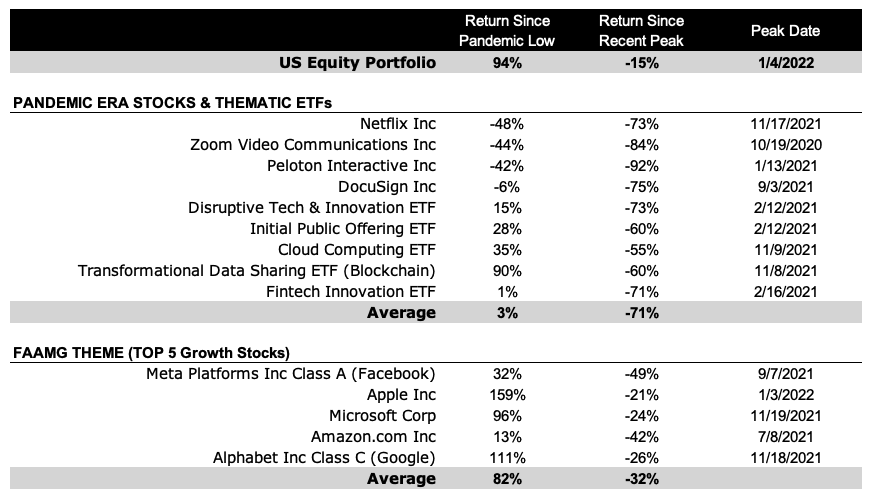
While it can be tempting to buy into new technologies and ideas, our experience tells us that investors rarely achieve the excess returns they seek in thematic bets—whether exposure is gained through individual companies or diversified funds. In fact, many of the hottest investment themes and individual companies that performed well at the onset of the pandemic have given up all of their initial outperformance.

Perhaps the most shocking example from the table below is the performance of Zoom Video Communications, whose stock has lost 44% of its value since the March 2020 low and is down a staggering 84% from its all-time high—all while growing its business exponentially since the onset of the pandemic.
IPO Performance
Zooming (no pun intended) into IPOs as one of the more popular themes of 2021, let’s look at how the 20 largest public offerings have performed since they started trading as well as from their 52-week high. On average, stocks included in the list are trading about 45% below their IPO Offer prices and more than 70% below their 52-week highs (the numbers turn out to be about the same if we extend the list to the top 100).
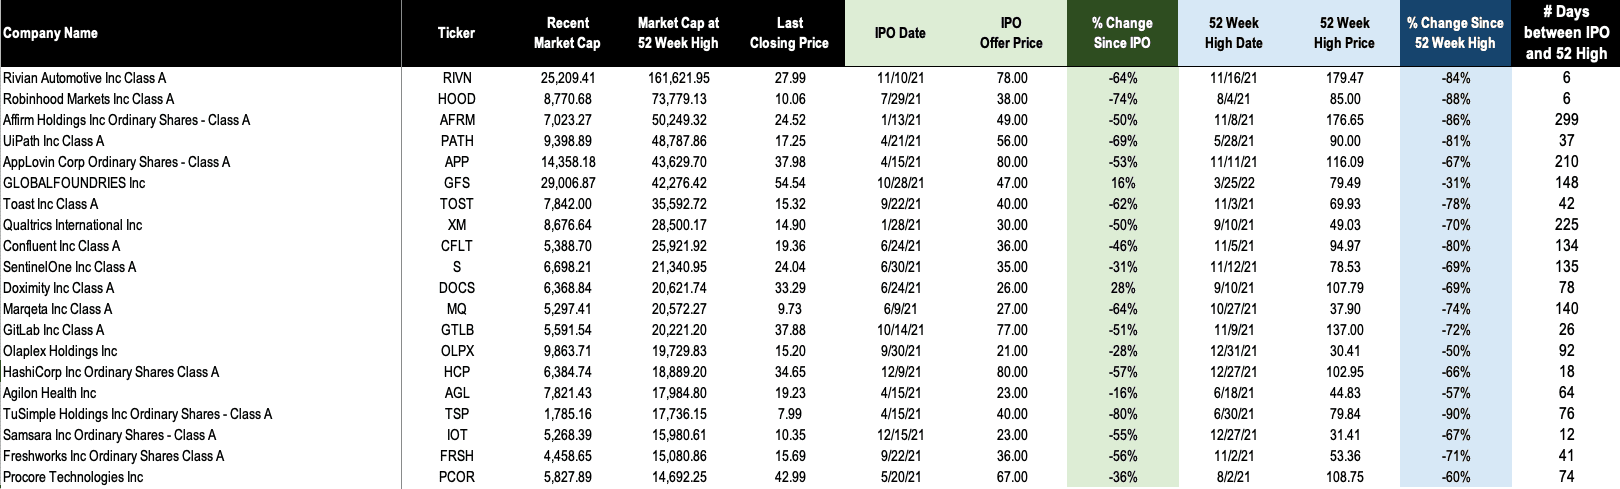
Since many of these stocks started trading well above their IPO price (unless you were awarded IPO shares), an individual investor who bought on the first day of trading is likely to have performed worse than indicated by the percentage change since IPO. At the same time, an investor would have to be exceptionally unlucky to invest at or near the 52-week high. But the two numbers together offer a reasonable range for where an investor could have ended up.
The collective market cap of last year’s 100 largest IPOs at their 52-week high totaled approximately $1.15 trillion. As of today, that total stands at $340 billion. If we look at the number of days that passed between the IPO and 52-week high, there doesn’t appear to be any reliable pattern. Some companies had strong returns for several months following their IPO, while others started crashing soon after.
As we’ve covered extensively in recent articles, chasing trendy investments—whether stocks or themes—rarely works out in the long term.
When Brighton Jones clients asked in 2020 what equities and strategies we should buy with new dollars, our response was more of the same strategies we already own. Just because the world changes over time, doesn’t mean your investment strategy should.
This article was originally published on April 23, 2022. It has been updated with more recent data.