Back to Basics: Thoughts on Cash Needs, Bonds, and Active Management
Brighton Jones Investment Committee Update: October 2017
The Brighton Jones Investment Committee convenes regularly to discuss current events, market trends, portfolio construction ideas, and our preferred and prospective investment managers.
Although the world of investing and capital markets offers no shortage of topics to cover each quarter, it’s important to periodically revisit some of the fundamental principles that support our work. It also just so happens that many of the questions we receive from clients relate to these foundational concepts. So, the theme of this quarter’s update is “Back to Basics.”
October’s update answers three commonly asked questions with the hope that our readers learn something new or further develop their existing knowledge:
- What is the purpose of the Cash Needs Analysis, and why protect 10+ years of cash needs?
- Why own bonds in this low-interest rate environment—aren’t we locking in low returns?
- Is active management the only option for investors to beat the index?
What is the purpose of the Cash Needs Analysis, and why protect 10+ years of cash needs?
At Brighton Jones, we take a more institutional approach to addressing the question of how much of a client’s portfolio should be invested in bonds or capital preservation. This approach, called liability immunization, is the same approach used by many pension fund managers. We call it our Cash Needs Analysis.
In a nutshell, the Cash Needs Analysis computes the next 10-15 years of annual withdrawal needs from a portfolio (if any) and then calculates the present value of those outflows. This present value becomes the lump sum that should be invested in capital preservation. The remainder can be invested in equities and other growth-oriented investments.
By employing this methodology, each portfolio has a customized allocation that directly relates to the cash needs required of the portfolio. For someone who is working and has no immediate need for their portfolio dollars, they may have little or no cash needs and therefore would require much less capital preservation. For someone who is retired and withdrawing funds from the portfolio each year, their cash needs would likely indicate a much higher percentage of the portfolio be invested in capital preservation investments.
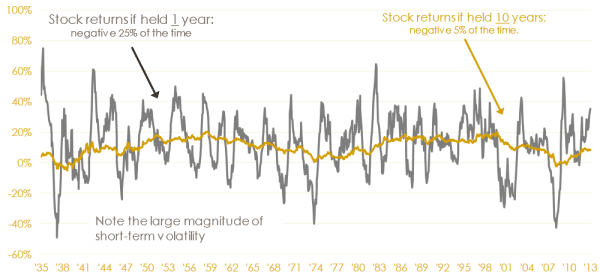
As illustrated by the graphic below, stock returns have a roughly 25 percent chance of being negative over any given one-year period, but just a 5 percent chance of being negative over any 10-year period. If we invest the next 10+ years of projected cash needs in safe investments, we’ve effectively bought ourselves a 10+ year time horizon to weather near-term market volatility.
Why own bonds in this low-interest rate environment—aren’t we locking in low returns?
Interest rates have been trending lower for decades, and after the credit crisis of 2008, central banks pushed rates even lower in an effort to stimulate the economy. The 10-year U.S. Treasury bond had a recent yield of 2.30 percent, up from a low of 1.45 percent last summer, but down from 5.0 percent just ten years ago. With yields hovering near historic lows, investors are growing weary of the impact low rates have on their portfolios. Furthermore, with rates more likely to increase vs. decrease in the years ahead (and the associated downward pressure this places on bond prices), many are asking why they should be invested in bonds at all.
The answer is twofold. The first part of the answer relates to the previous question. Stated simply, capital preservation plays an important role in prudent portfolio construction. When clients rely on their portfolios for reliable cash flows, regardless of market environment, we need to ensure that those cash flows are protected. Although we seek the best return profile we can for capital preservation assets, return is secondary to safety. When global equity markets imploded in 2008, our capital preservation portfolios provided essential ballast.
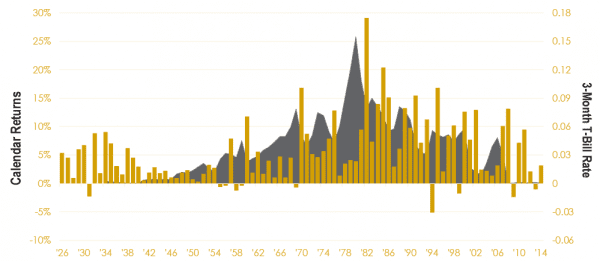
The second part of the answer challenges the assertion that in a rising interest rate environment, bond investors cannot earn a positive return. The chart below illustrates 80+ years of bond market history. The brown bars represent the annual return of 5-year Treasury bonds, and the gray shaded area represents short-term rates. As the chart shows, this isn’t the first time in modern investment history that we’ve been coming off near-zero interest rates. Yet as short-term rates increased dramatically through the later 1970s, 5-year Treasury bonds had a decidedly positive return profile, save for a handful of slightly negative years.
What can we learn from this? The first lesson is that a rising interest rate environment does not guarantee negative or low bond returns. In fact, if the bond portfolio is shorter in duration, a gradually rising interest rate environment may ultimately have a positive impact on the return profile of the portfolio. As shorter-term bonds mature, the proceeds get reinvested into new bonds with higher interest rates. This has the effect of continuously “resetting” the yield of the bond portfolio, keeping its yield more closely aligned with what the market has to offer.
In summary, then, even with interest rates near historic lows, we remain committed to the critical role that capital preservation bonds play in a diversified portfolio, and would not suggest any significant shifts in strategy as a result of where we’re at in the interest rate cycle.
Is active management the only option for investors to beat the index?
The quest to outperform market averages has been a fixture of the investment world since the dawn of the modern stock market. What started with Benjamin Graham (the so-called “father” of value investing) has evolved into a multi-billion-dollar industry of MBA-wielding analysts, Ph.D. computer scientists, billionaire hedge fund managers, and high-frequency trading algorithms. Yet for all the time, effort, and resources invested in beating the market, the ability to consistently outperform market averages, particularly after taxes and transaction costs are accounted for, remains elusive.
Brighton Jones believes that markets, on average, place a fair price on what a security is worth. The market may not always get it right, but on average, prices fairly approximate the intrinsic value of the assets they represent. With this as a fundamental premise, the notion that an investment manager could consistently outsmart the collective wisdom of the market quickly breaks down. Ironically, those who go to such great lengths to beat the market only serve to reinforce this fundamental premise by making the market even more efficient. The more they seek to find inefficiencies, the fewer efficiencies remain to exploit.
When we look at the data, we find that over 10+ year time periods, 4 out of 5 active managers underperform their benchmark, and coming up with a reliable system (in advance) to identify the 1 out of 5 managers that do outperform has proven extremely difficult.
But what if we could devise a system that allowed you to select, in advance, the active managers that will outperform their benchmark? The data would suggest that when managers outperform, very few outperform by more than 1 percent per year, and yet those that underperform do so by several percentage points. The investor is put in a situation where A) picking the 1 out of 5 active managers that will outperform is exceedingly difficult and B) even if the investor is lucky enough to pick the outperformer, they may only outperform by 1 percent per year (and risk underperforming by a much larger margin). The graphic below illustrates this dynamic.
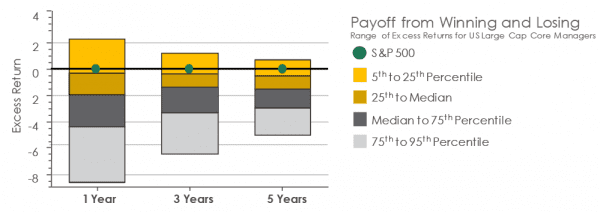
If an investor is capturing the returns freely offered by the market, are they merely “average?” Per the graphic above, if we’re able to capture the returns of the S&P 500 (represented by the blue line), and we compare that to the outcomes achieved by active managers trying to beat the S&P 500, our outcome would put us in the 25th percentile! Far from being average, we’ve just outperformed over 75 percent of the competition.
If a common index fund is already in the 25th percentile relative to active peers, can we do even better? Brighton Jones believes we can through an evidence-based, academic approach to investing in asset classes. This approach doesn’t involve stock-picking or market timing, but instead harnesses the power of investing in factors—characteristics like company size (small vs. large), relative price (value vs. growth) and profitability (high vs. low). By tilting a portfolio toward these three factors (small, value and high profitability), there is strong academic evidence to suggest that investors will be paid a premium relative to their counterparts (large, growth and low profitability).
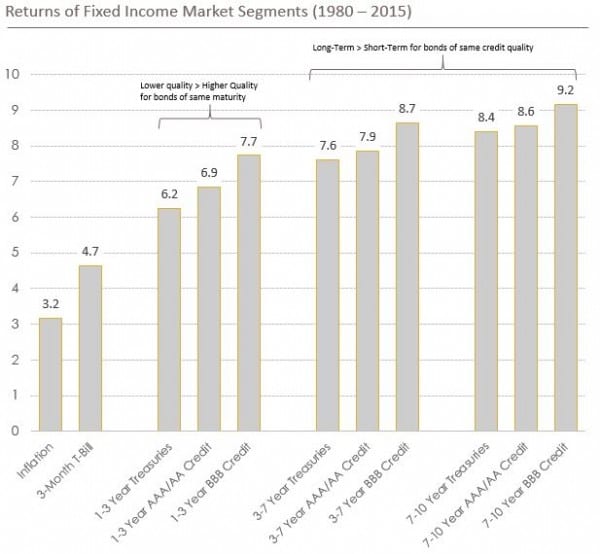
As shown in the chart below, these premiums have been considerable over multi-decade timeframes, but they don’t occur in every single time period. For an investor to profit from these strategies, a long-term, disciplined approach is essential.
To capture these premiums efficiently and effectively, Brighton Jones partners with an institutional-only manager with deep academic roots, including several Nobel laureates. Their mutual funds take the power of this rich academic heritage and allow us to implement factor-based strategies for our clients.
So can we do better than average without taking unnecessary or excess risk? With the proper time horizon and an allocation that takes advantage of proven risk factors, we believe the answer is yes, especially when combined with a holistic approach that includes tax management and comprehensive planning.
Read more from our blog: