A Case Study on Performance Chasing
On Hiring, Monitoring, and Replacing Investment Managers
For individual and institutional investors alike, the challenge of constructing portfolios that deliver benchmark-beating returns is twofold. The first challenge pertains to the sheer difficulty of gaining and sustaining an enduring, useful advantage over all other investors in the selection of individual securities. But, most investors—including large pension funds and endowments—do not select individual securities themselves; they hire investment managers to select securities for them. Hence, the second challenge arises from the need to hire, monitor, and potentially replace third-party investment managers.
We have written extensively in the past about the first challenge—the difficulty of beating the market. With so many competitors simultaneously seeking superior insights into the price-value relationship of financial securities, and with so much information so widely and rapidly communicated throughout the investment community, the chances of a single investor discovering and exploiting profitable insights over multiple business cycles are not promising. This applies to well-funded investment complexes with offices in every major market just as much as it applies to hobbyist individual investors who devote only a fraction of their time to studying capital markets. Indeed, industry statistics (SPIVA) showing that nine out of ten mutual fund managers failed to outperform their benchmark over the fifteen-year period ending December 2016 demonstrates the uphill battle facing active investors.
Nine of ten mutual fund managers failed to outperform their benchmark over the 15-year period ending December 2016.
While there exists an extensive body of literature that explores the challenge of beating the market (i.e. the so-called active-passive debate), the body of literature that explores the challenge of hiring, monitoring, and replacing third-party investment managers is scarce in comparison. The reason for this research gap is understandable: it is a relatively straightforward exercise to compile the data necessary to calculate the success rate of mutual fund managers and then determine if manager performance—good or bad—persists from one period to next. Such an analysis is made possible by the fact mutual funds are required to report performance information. But, there does not exist a database in which every investor is required to log their hiring and firing decisions of third-party investment managers. While we can determine from the aggregate level data that the average investor fails to achieve benchmark-beating performance, it is impossible to determine whether there exists a subset of investors who consistently hire and fire the right managers at the right times.
Since launching the Institutional Asset Management arm of Brighton Jones a few years back, we have worked with several corporate and non-profit investment committees tasked with selecting investment managers for their retirement plans or endowment assets. Whereas the individuals and families seeking our Personal CFO services do not come to us with a detailed history of every investment they have ever held, most organizations do retain such records internally. Having reviewed the historical records of several institutional investors in recent years, we can shed new light on the underappreciated challenge of constructing portfolios of benchmark-beating investment managers.
In this briefing, we outline our framework for analyzing the historical hiring and firing decisions made within a large corporate retirement plan for a prospective institutional client. Our aim is to demonstrate how following conventional wisdom when hiring, monitoring, and replacing active managers can lead to disappointing investment results. While this briefing centers on the hiring and firing decisions made within a corporate retirement plan, the lessons to be learned are equally applicable to individual investors.
Asking the Right Question
Among the most common requests made to our Retirement Plan Services group by prospective institutional clients is for a performance comparison of the active investment managers currently available in their retirement plan and the index-like investment strategies we recommend. The glaring problem with this request is organizations that employ active management typically replace underperforming managers with new managers that have better track records up to the point they are hired. Of course, if previous underperformers are fired and replaced by previous outperformers, a list of currently held active managers will almost always look good; but that does not mean any of the managers were available investment options during their best years. Hence, a better (albeit more complicated) question to explore is whether the cumulative impact of hiring and replacing managers over time has resulted in benchmark-beating performance.
If previous underperformers are fired and replaced by previous outperformers, a list of currently held active managers will almost always look good.
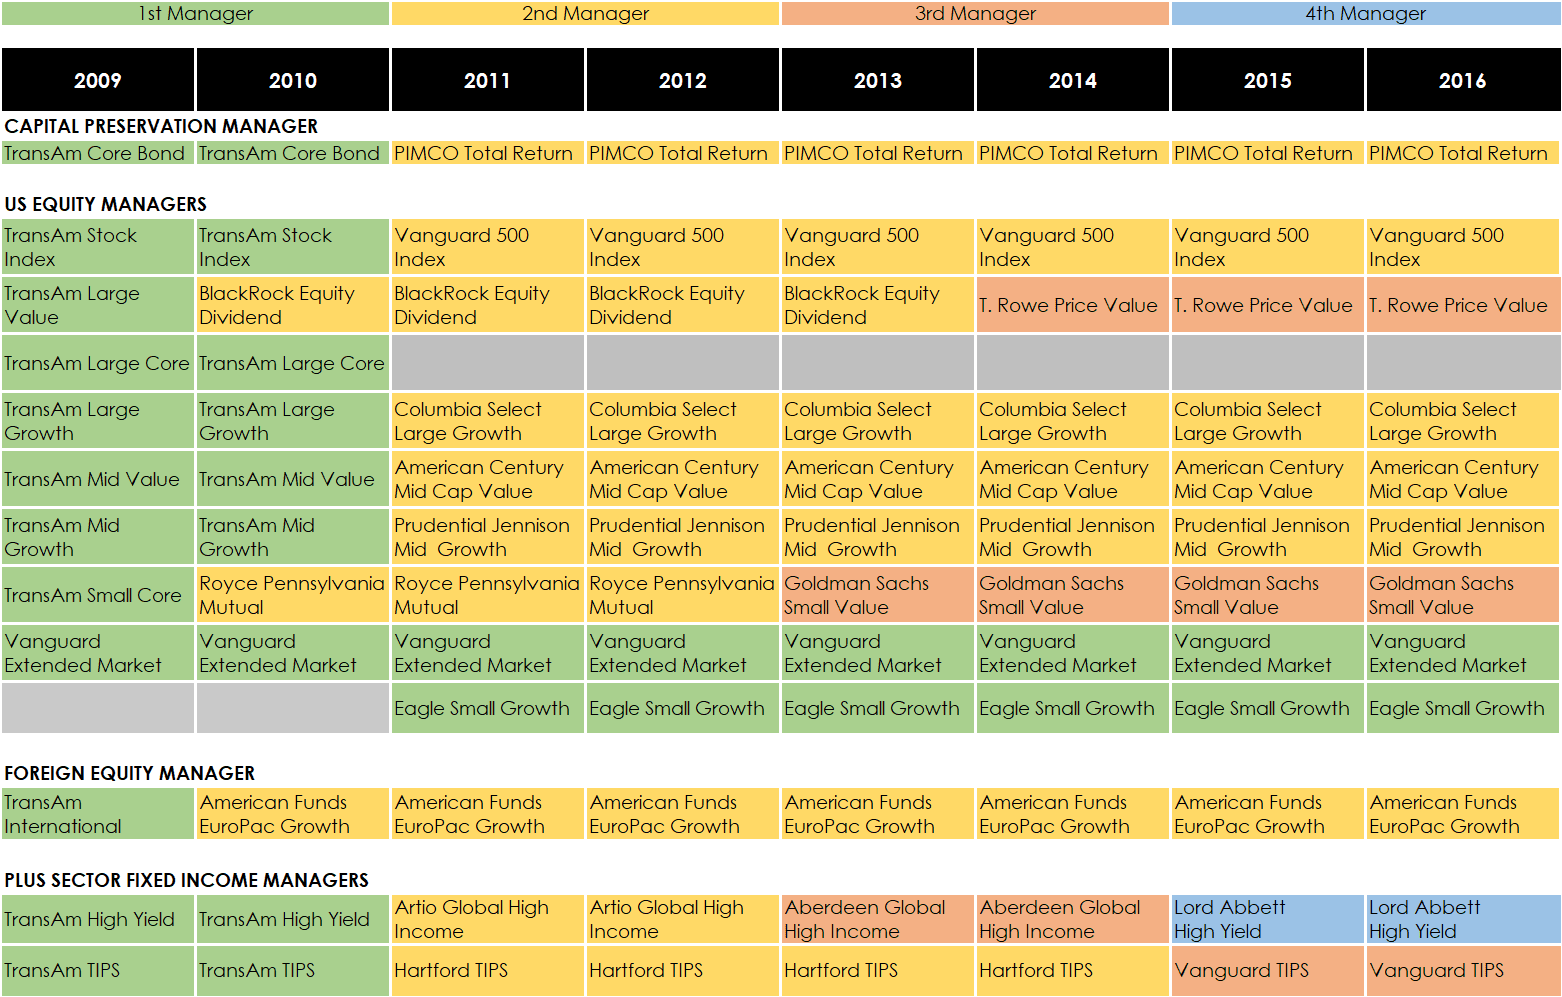
Our framework for quantifying the cumulative impact of hiring and firing decisions begins with identifying the investment options that were made available to retirement plan participants each year. The table below is a useful format both for showing the managers that were available and revealing when changes were made in each market segment (via color-coded cells):
Assessing Hiring and Firing Decisions
Having identified the investment strategies that were available each year, we can now quantify the cumulative impact of hiring and firing decisions in each market segment. Below, as one example, we list the three US Large Cap Value managers that were available to plan participants from 2009-2016 along with the calendar year and annualized returns of each strategy. We then indicate when each of the three managers were available via green highlighted cells (i.e. Transamerica Large Value was available in 2009, Blackrock Equity Dividend was available from 2010-2013, and T. Rowe Price Value was available from 2014-2016).
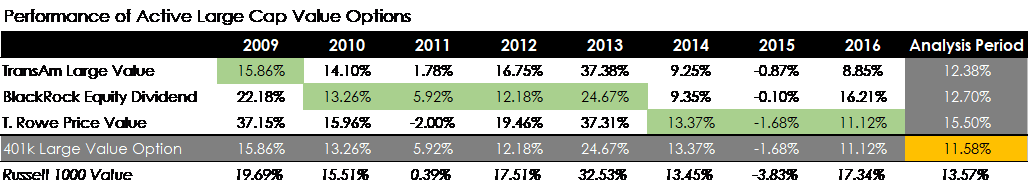
Now, when plan participants review the performance of their currently available investment options, they will likely be pleased to see that T. Rowe Price Value has returned 15.50 percent per year over the past 8 years as compared to 13.57 percent for its benchmark, the Russell 1000 Value Index. In turn, plan participants are likely to have a favorable impression of active management.
However, if we derive the stream of returns earned by plan participants based on the timing of when each manager was available, their perception will no longer be so favorable. Indeed, based on the time periods each of the three managers were available, plan participants will have realized a return of just 11.58 percent in the US Large Cap Value market segment. In effect, plan participants underperformed the benchmark by 2 percent per year and trailed the track record of the incumbent manager by nearly 4 percent per year. It is also noteworthy that the 11.58 percent return earned by participants is less than the return of all three managers over the full analysis period, meaning participants would have been better off investing in any one of the three strategies from start to finish without any changes.
There are far too many investors who believe they can achieve superior performance than is statistically possible.
The fact that most money remains invested in active strategies means most investors are not too concerned about the failure rate of mutual fund managers. It might be the case that nine out of ten active managers fail to outperform their benchmark, but why should that matter to the investor who thinks he can hire and fire the right managers at the right time? The problem, of course, is there are far too many investors who believe they can achieve superior performance than is statistically possible; and the problem persists because most investors never go back and assess the quality of their past decisions (so they never learn).
As this exercise demonstrates, the track record of the investment managers you hold today is irrelevant; it’s the combination of different managers you have held at different times that matters.
Window Dressing the Manager Line-up
Corporate and non-profit investment committees often retain the services of an investment advisor to assist in the selection and monitoring of third-party investment managers. Most investment advisory firms that employ an active investment strategy can furnish a white paper or two outlining their process for hiring, monitoring, and replacing investment managers. Such white papers often go by titles like “The Science and Art of Manager Selection” or “The Four P’s of Manager Due Diligence” (i.e. philosophy, people, process, and performance). Most of these well-sounding white papers will begin with a short spiel that goes something like this: “the phrase past performance is not indicative of future results can be found in the literature of every investment strategy, yet most investors will ignore this warning and select managers almost exclusively based on past performance [true]. That is, everyone except us [doubtful]. Only after a thorough organizational review where we determine that a manager’s philosophy is sound, that their team of people is talented, and their processes are repeatable will we seek confirmation of our conclusions in their historical performance record.” The only problem is, every active investor says they don’t chase the proverbial hot hand, but the data suggest otherwise. Mutual fund managers with strong recent performance attract new assets, while those with weak recent performance suffer redemptions.
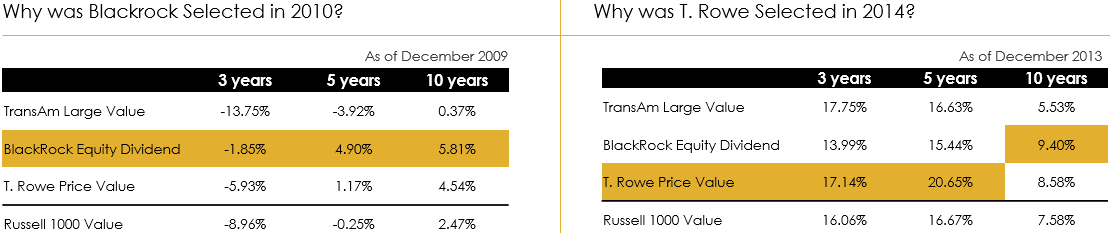
To be sure, in the table below, we show the trailing returns of Transamerica Large Value, Blackrock Equity Dividend, and T. Rowe Price Value as of December 2009 (left) and December 2013 (right) to reveal why Transamerica was replaced by Blackrock in 2010, which was subsequently replaced by T. Rowe price in 2014. As expected, Blackrock Equity Dividend outperformed Transamerica Large Value by 5.44 percent and the Russell 1000 Value Index by 3.34 percent per year over the 10-year period ending December 2009. If we then fast forward a few years to see why Blackrock was replaced by T. Rowe Price, the same pattern persists: T. Rowe Price outperformed the incumbent manager by 5.21 percent and the benchmark by 3.98 percent per year over the 5-year period ending December 2013. Rinse, wash, and repeat…
As we all know from personal experience it typically does not pay to switch from one line to another—not at ticket counters, border crossings, airport security, or even at the grocery store checkout. Likewise, nearly certain disappointment awaits the investor who hopes to generate market-beating returns by repeatedly moving from one investment strategy to another.
Now, it goes without saying that investment advisors who engage in “window dressing” their line-up of investment managers deserve a slap on the wrist. But the individuals and organizations that hire investment advisors should also understand how their criteria for selecting and retaining an investment advisor can ultimately drive this behavior. For example, there are several valid reasons as to why you might consider investing in one or more mutual funds with a 2 or 3-star Morningstar rating, but many balk at the idea of investing in funds that don’t have a 4 or 5-star rating. In effect, investment advisors can be driven to present a list of 4 and 5-star managers to prospective clients (even though that list of managers might change from one period to the next), just as they can be driven by client demand to replace low-rated strategies with high-rated strategies.
It doesn’t pay to switch from one line to another—not at ticket counters, airport security, or even at the grocery store checkout.
As such, our warning is simple: It is easy for any advisor to furnish a list of recent top performers, just as it is easy to remove a recent underperformer as a line item on a holdings report, but speed dating mutual fund managers is unlikely to result in a satisfactory outcome, much less a superior one. The important test of an investment concept or philosophy is one’s ability to adhere to it persistently for valid, long-term reasons even when the short-term results are disagreeable.
The Bigger Picture
To this point, we have introduced a framework for quantifying the cumulative impact of hiring and firing decisions made within a sub-asset class (i.e. US Large Cap Value). We have also demonstrated how chasing the hot hand can produce investment results inferior to that of a relevant index. But, ultimately, investors do not invest in just one market segment; they construct diversified portfolios of many managers across several market segments. Hence, an even better (and even more complicated) question to explore is whether the cumulative impact of hiring and firing decisions across several market segments has produced returns superior to that of a single, broad market index fund. To repurpose our earlier question: so what if nine out of ten managers underperform their benchmark if the excess return of the winners more than offsets the underperformance of the losers?
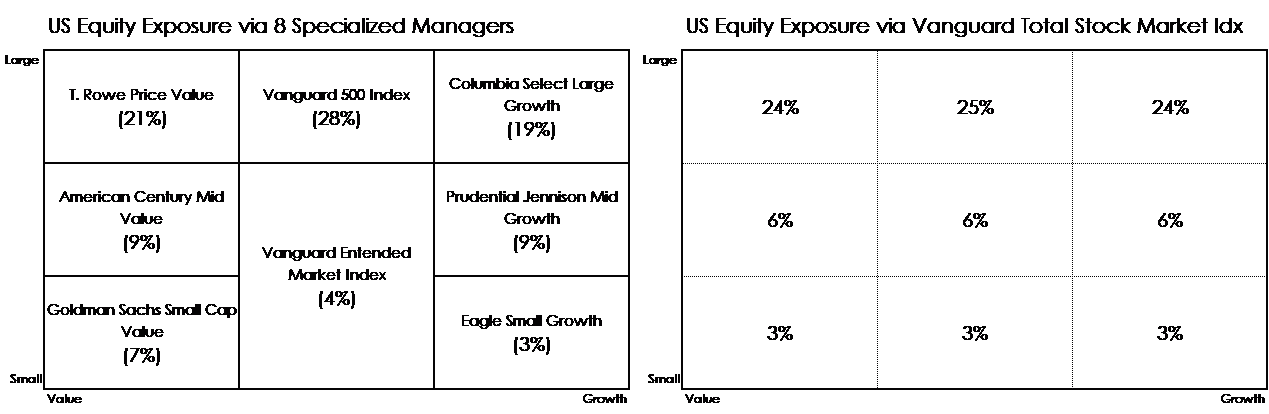
In the next stage of our analysis, we calculate an estimate of the returns plan participants earned in U.S. equities based on the relative amounts invested in each strategy over time. We then compare how plan participants fared in the broad U.S. market using several managers as compared to a single strategy, the Vanguard Total Stock Market Index.
To illustrate, the diagram below shows how plan participants were allocated among the eight available U.S. equity options in the most recent period (left). After creating similar models for each year of the analysis period, we will be able to estimate the return plan participants achieved based on how they were invested in the available managers each year. For comparison, we also show how the Vanguard Total Stock Market Index fund is diversified among companies of different size (i.e. large, medium, small) and style (i.e. value, neutral, growth). Before comparing the performance of these two approaches, it is important to note that plan participants have had very comparable market exposure (across the size and style spectrum) to the Vanguard Total Stock Market Index (so we know we are making an apples-to-apples comparison).
So, what do the results show? Over the full 8-year analysis period, we estimate that plan participants returned 13.8 percent per year on their combined U.S. equity investments as compared to 14.8 percent per year for the Vanguard Total Stock Market Index. In effect, plan participants underperformed by 1 percent per year.
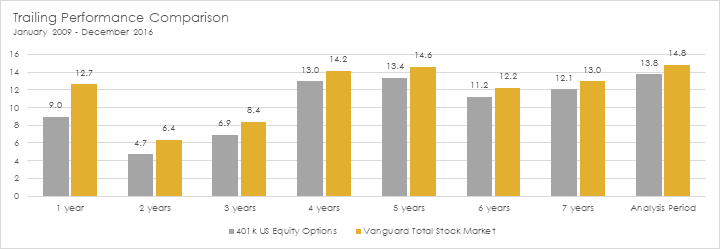
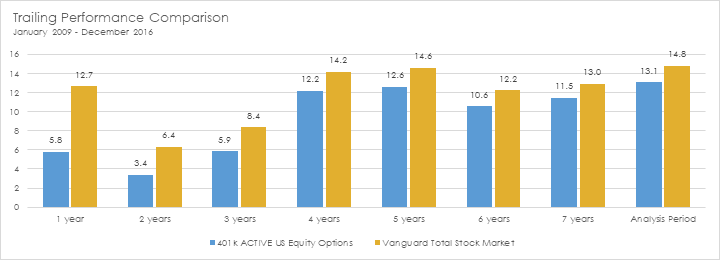
Now, it is also important to point out that the U.S. equity investments of plan participants underperformed the Vanguard Total Stock Market Index by 1 percent per year with nearly 1/3 of the assets invested in index funds (i.e. Vanguard 500 Index and Vanguard Extended Market Index). In effect, this means the active component must have underperformed by even more. If we redistribute the percentage weights held in index funds 50/50 between the active value and growth strategies, then we will be able to isolate the true performance gap created by hiring and replacing active investment managers. As shown in the chart below, our recalculated return estimate reveals the active component underperformed by about 1.7 percent per year (13.1 percent vs. 14.8 percent) during the 8-year analysis period.
In the spirit of full disclosure, we do not present this case study as proof that investors cannot successfully hire and fire the right managers at the right times to generate benchmark-beating returns, although we clearly have our doubts. As previously noted, we simply do not have at our disposal the data necessary to make such a conclusion. Instead, we present this case study to demonstrate how following conventional wisdom when hiring, monitoring, and replacing active managers can lead to disappointing investment results.
An Inconvenient Truth
The idea of an index fund first appeared in 1960 when University of California economist Edward Renshaw co-authored a paper, “The Case for an Unmanaged Investment Company,” with MBA student Paul Feldstein.
Renshaw and Feldstein examined the investment landscape at the time and noted the number of mutual fund options was growing at a staggering rate, yet many of these funds failed to outperform the Dow Jones Industrial Average. It wasn’t until eleven years later that the first index strategy would be implemented when the Samsonite Luggage Company approached Wells Fargo to create a portfolio that tracked the total U.S. stock market for its pension plan.
Ever since, investors have been engaged in the emotionally-charged, quasi-religious active-passive debate. On one end of the spectrum, active investors believe markets often misprice securities in ways that can be routinely exploited for profit. Alternatively, passive investors believe any pricing errors are negligible, unpredictable, and dynamic in nature (i.e. always changing)—such that they cannot be consistently and repeatedly exploited for profit, especially after considering the higher management fees, transactions costs, and tax liabilities generated by actively managed portfolios.
In large part, the active-passive debate is fueled by the availability of data on mutual fund managers. Index investors cite the failure rate of active mutual fund strategies and the lack of persistence among managers who previously outperformed as reasons for avoiding active strategies. Alternatively, active investors believe they will be able to hire and fire the right managers at the right times to generate market-beating returns, net of frictional costs.
But, because investors who employ third-party managers are not required to report their hiring and firing decisions, it is impossible to determine the ratio of investors who successfully earn benchmark-beating returns. Having said that, if nine out of ten mutual fund managers underperform their benchmark over extended periods, it seems unlikely the success rate of investors who construct portfolios of several third-party active managers will be any better.
On the Order of Horses and Carts
Given our level of skepticism surrounding the ability of (1) active managers to consistently outperform their benchmark and (2) individual investors to successfully hire and fire the right managers at the right times, it remains our firm belief that investors are best served investing in low-cost, tax-efficient, and broadly diversified strategies managed by shareholder-friendly firms. But, it is worth establishing that manager selection represents just one step in the portfolio construction process.
Investors are best served investing in low-cost, tax-efficient, and broadly diversified strategies managed by shareholder-friendly firms.
At Brighton Jones, our overarching investment objective is to construct individually-tailored portfolios that provide each of our clients the highest probability of achieving their unique financial goals, while earning a fair payout for the risks they take. To that end, our portfolio construction process prioritizes—in order of importance—the factors most likely to increase the probability that our clients will achieve their goals. As a refresher, here is what this process looks like:
Portfolio Construction Process
- Determine Financial Objectives | Desired lifestyle, capacity to save, tolerance for risk, required return, etc.
- Set Broad Allocation Policy | Divide portfolio assets into a short-term capital preservation bucket (that protects near-term needs and lowers portfolio volatility) and a long-term, higher growth-oriented bucket.
- Set Sub-Asset Allocation Policy | Determine relative portfolio weights (e.g. domestic vs. foreign, large cap vs. small cap, value vs. growth, short vs. long-term bond maturities, etc.)
- Optimize Asset Location | Optimize use of taxable, tax-deferred, tax-free accounts based on the relative tax efficiency and growth potential of each asset class.
- Manager Selection | Decide how to capture the returns of each market segment (i.e. active vs. passive)
- Monitoring (periodically revisit steps 1-5)
- Adjust allocation as personal circumstances change
- Rebalance asset class exposure as portfolio weights drift from their targets
- Tax loss harvest
Now, it is worth reiterating that manager selection comes last in our portfolio construction process (excluding ongoing monitoring) for good reason:
- It does not matter which manager(s) you invest in if you get the allocation decision wrong. With an overly aggressive allocation, an investor may not be able to maintain discipline in turbulent market environments. With an overly conservative allocation, an investor may not earn a rate of return sufficient to fund future spending goals. An investor who allocates money that may soon be needed in volatile market segments runs the risk of having to sell at an inopportune time.
- It does not matter which manager(s) you invest in if you are concentrated in the one market segment that performs poorly. Every company (e.g. MSFT), sector (e.g. technology), region (e.g. Japan), and asset type (e.g. stocks) is susceptible to periods of poor performance that can unexpectedly last for a decade or longer. Inadequate diversification among and within market segments can put long-term goals in jeopardy.
- It does not matter which manager(s) you invest in if frictional costs are not kept in check. Fees, commissions, and taxes are unavoidable, but they must be reasonable. Left unchecked, frictional costs can erase the outperformance of even the best managers.
In short, it is our belief that the real opportunity to achieve superior long-term investment results lies not in scrambling to find the next top manager, but in thoughtfully implementing an individually-tailored portfolio with a process that measures the appropriate level of risk to be taken, establishes the right asset allocation policy, effectively diversifies across different asset types and regions, optimizes tax efficiency, minimizes costs, and mitigates the potential for behavioral miscues.
Read more from our blog: