Market Summary and Historical Perspective
Building on the double-digit gains of 2012, the S&P 500 Index closed out the first quarter of 2013 at a record closing high of 1,569, netting investors a total return of 10.6%. As seasoned investors are keenly aware, this is not the first time the S&P 500 Index has staged a run at the 1 1,600 mark. The index reached 1,527 in March 2000 before falling to 777 in the wake of the technology bubble. The index then reached 1,565 in October 2007 before plummeting to an even lower price level of 677 in the aftermath of the global credit crisis. With domestic stock indexes setting new highs once again, many investors are questioning whether stock prices have come too far too fast.
Valuation: Then vs. Now
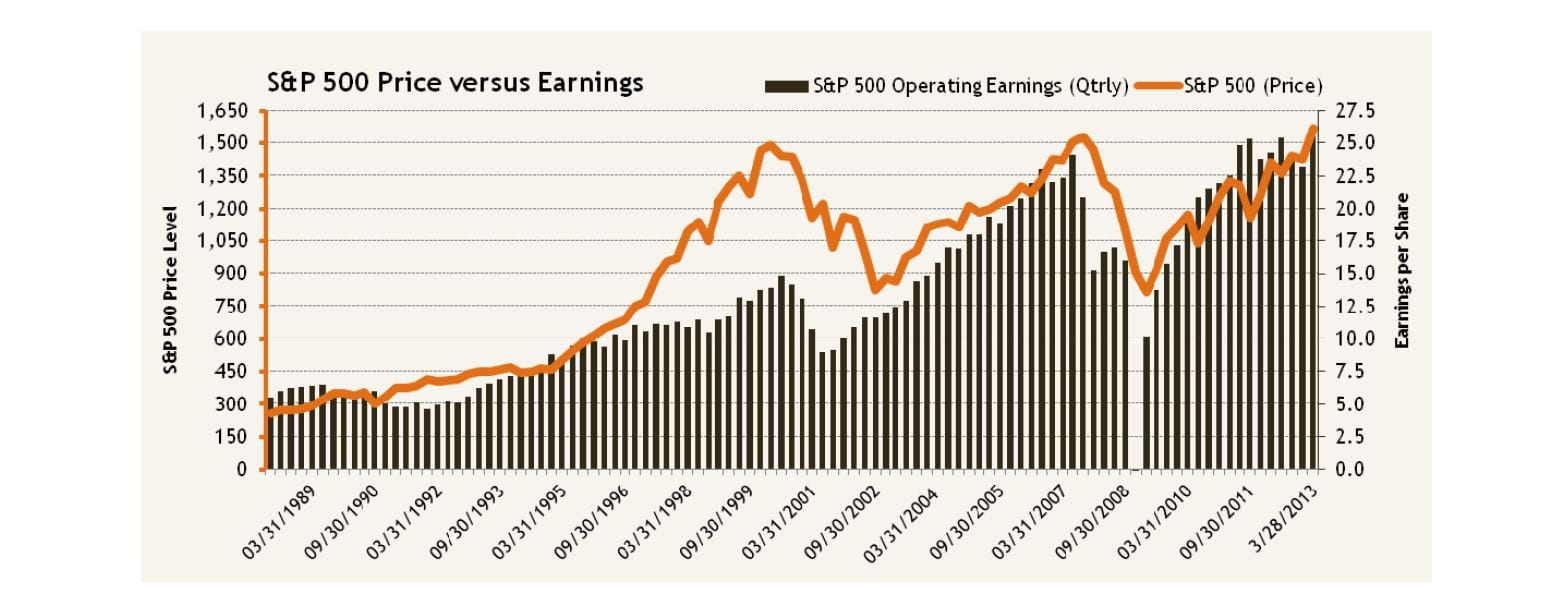
Historically, the price‐to‐earnings ratio of the stock market has displayed an inverse relationship with future returns, making it a useful data point for gauging whether stock prices have overshot reasonable valuations. That is, a low starting P/E ratio has been indicative of higher‐than‐average future returns over intermediate time horizons, and vice versa. To best illustrate the difference between then (2000) and now, we plot the price level of the S&P 500 Index (orange line) versus reported operating earnings (brown columns). As illustrated, the run-up in stock prices during the late 1990s and early 2000s was not supported by comparable earnings growth. As stock prices soared without fundamental support from higher earnings, the P/E ratio of the market expanded to a staggering 28x in March 2000. Seasoned investors need no reminding that the subsequent 10 year period was not favorable to the broad U.S. stock market indexes. However, as also illustrated, the recent run-up in stock prices does have fundamental support from higher earnings. The P/E ratio for the S&P 500 index now stands at 16x, below the October 2007 reading of 17x and on par with its long‐term average.
Relative Valuation
The P/E ratio measures the stock market purely on its own and without regard to other factors, most notably interest rates. Another useful yardstick that can be used to gauge the relative attractiveness of stocks is to compare the earnings yield (i.e. the inverse of the P/E ratio to the E/P Ratio) of the market to the inflation‐adjusted yield of investment‐grade (Baa rated) corporate bonds and U.S. Treasury notes. The underlying premise is that investors can determine the relative trade‐off of owning stocks versus bonds based on the spread between their respective yields. When the spread between yields is narrow, stocks may be perceived as relatively expensive, and vice versa. As illustrated below, the current spread between the earnings yield of the market and the two bond yields remains much wider than its average over the past few decades, indicating that stocks remain attractive relative to bonds. This is in stark contrast to the technology bubble era when the real yield on Baa rated corporate bonds exceeded the earnings yield of the S&P 500.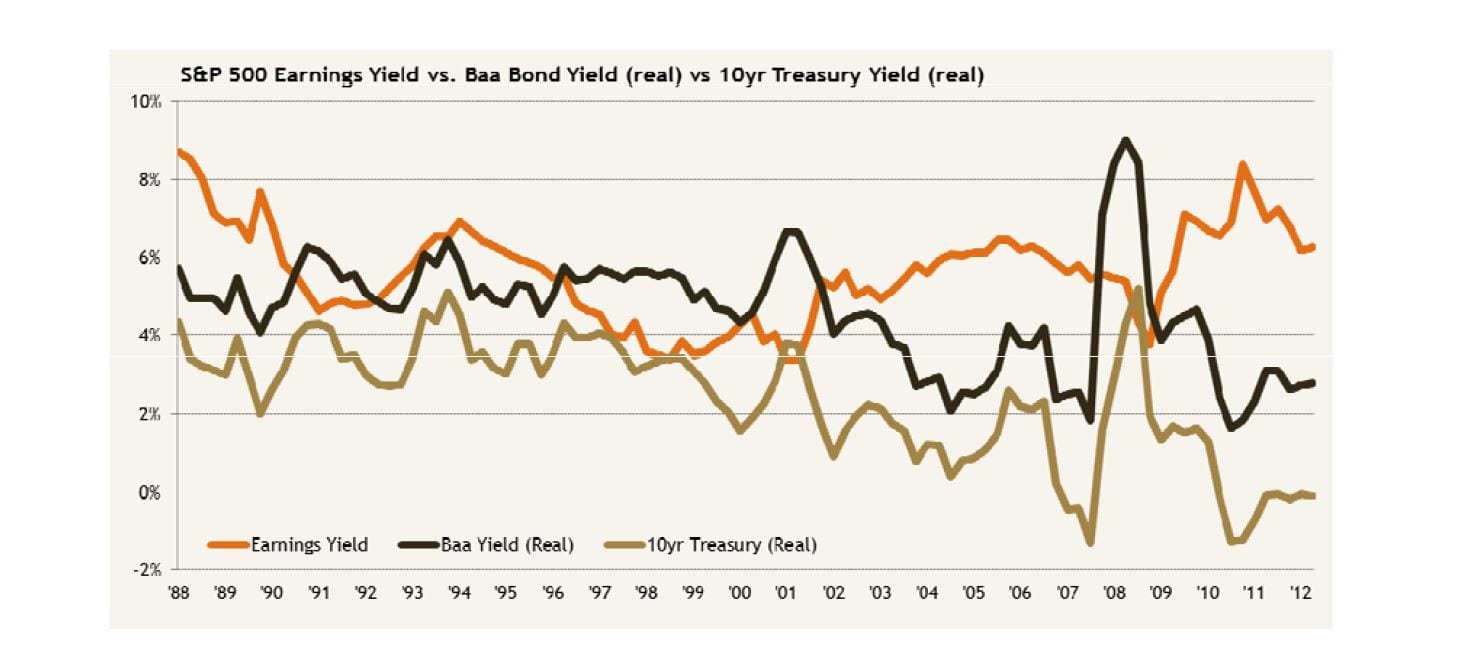
The bottom line is that stocks are not the cheapest they’ve been in the past four years, but they also are not overvalued on an absolute basis and certainly not on a relative basis. But, this should not surprise our clients and regular readers. In our Q2‐2012 Market Update, as the eurozone was in the midst of another default scare, we warned that valuations would likely be much higher by the time cheerier headlines dominated the media and we suggested that disciplined investors would ultimately prevail to earn the higher returns forgone by naysayers. To the benefit of our clients, global stocks are up nearly 20% since June of 2012.
What’s Next? A Historical Perspective on Market Runs
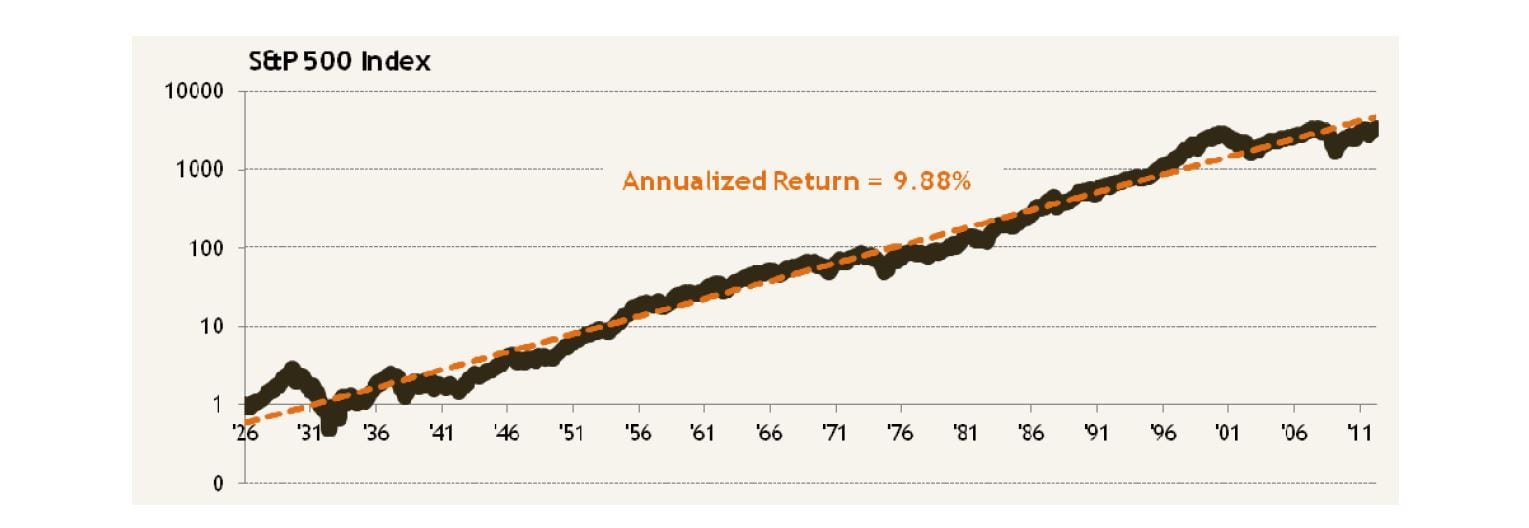
The following chart, a popular tool among investment management companies illustrating the benefit of stock ownership, perpetuates the expectation that stocks trend higher in a relatively consistent manner month after month, year after year. As your advisor, it is our job to replace this notion with realistic expectations of market returns—both good and bad—so that together, we can most effectively manage the long‐term growth of your portfolio.
By the Numbers
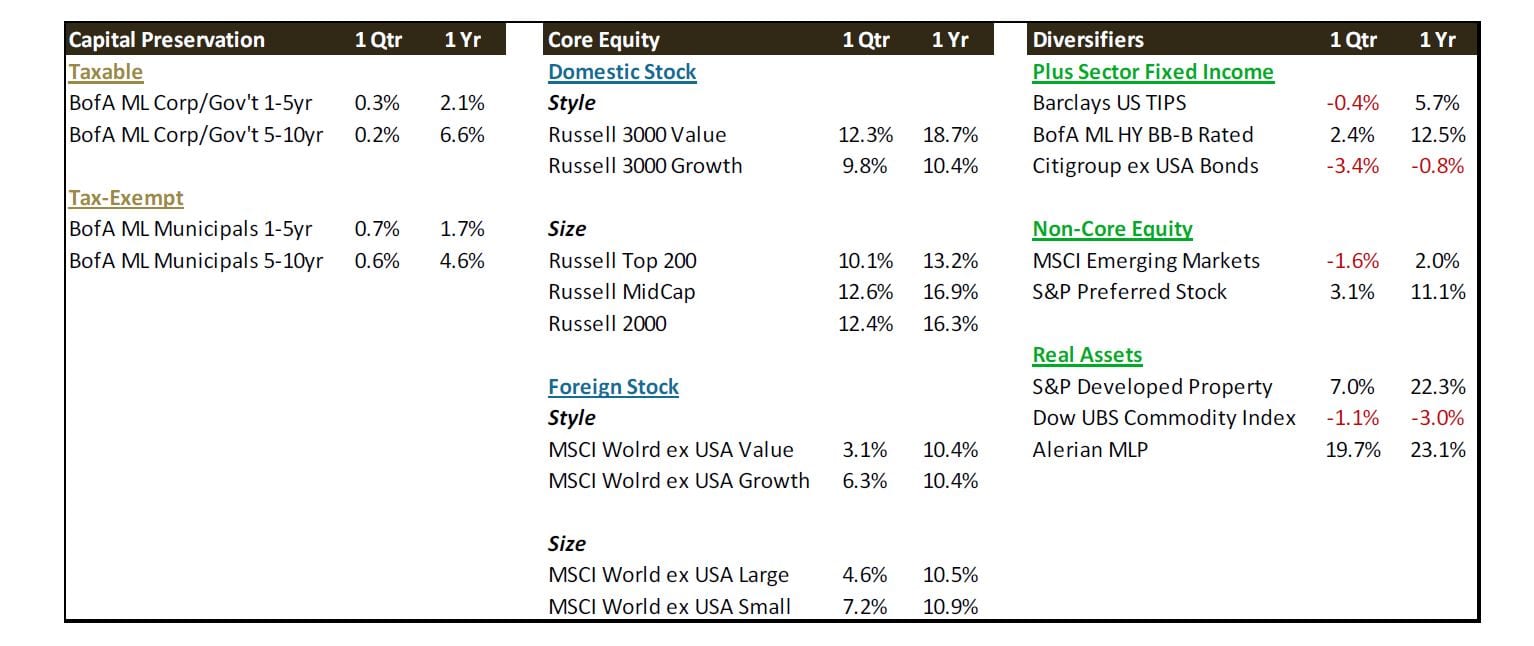
Bond yields crept higher and credit spreads narrowed during the first quarter on the back of stronger‐than‐expected economic momentum in the U.S. and a reduction in the negative tail risks (i.e. fiscal cliff, euro crisis, political gridlock) that weighed down investor sentiment in previous periods. The impact on fixed income securities was relatively muted, with the negative impact of higher rates being offset by narrowing credit spreads Overall bond investors eked out slightly positive gains; however bonds denominated in foreign currencies were negatively impacted by a strengthening dollar.
The U.S. stock market pursued new record highs in March, also in response to better-than-expected economic data (e.g. housing recovery gaining traction) and evidence that the U.S. consumer was absorbing the 2% payroll tax hikes better than anticipated. All US market segments posted positive results in the first quarter, with the broad market returning 11.07%. Across the size spectrum, small caps outperformed large caps. There was a positive value premium market wide in the US, driven by the performance of large value and midcap value stocks; however, small-cap value stocks underperformed small-cap growth stocks. International developed equities maintained strong performances, with all major market segments posting positive absolute numbers in US dollars for the quarter. The US dollar appreciated 4% relative to a broad basket of foreign developed currencies, thereby acting as a performance drag to non‐dollar denominated assets. Across the size and style spectra, small beat large and growth outperformed value.