The Normalcy of Volatility, Revisited
As of the close of trading on December 24, 2018, all major stock market indices have officially entered a bear market, having declined more than 20 percent from peak levels.
We have all heard the lessons of sound investing over and over, but admittedly, it is never easy to adhere to a long-term plan in the face of short-term uncertainty. For investors, however, the difference between success and failure generally lies in the execution of a plan and adherence to a process, particularly during periods of heightened volatility. In turn, simply knowing what to expect in terms of volatility is a critical ingredient to staying committed over the long-term.
Given that U.S. equity investors have enjoyed several years of strong equity market returns, it may be timely to revisit what we call the normalcy of volatility. The chart below shows calendar year returns for the U.S. stock market since 1979, as well as the largest intra-year declines that occurred during a given year. During this period, the average intra-year decline was about 14 percent. About half of the years observed had declines of more than 10 percent, and around a third had declines of more than 15 percent.
Despite frequent bouts with volatility, the U.S. stock market enjoyed an 11.8 percent compound annual growth rate (including reinvested dividends) during the analysis period. While the current decline of 20 percent is above average, it is by no means extraordinary—just normal.
U.S. Market Intra-Year Gains and Declines vs. Calendar Year Returns, 1979–2017
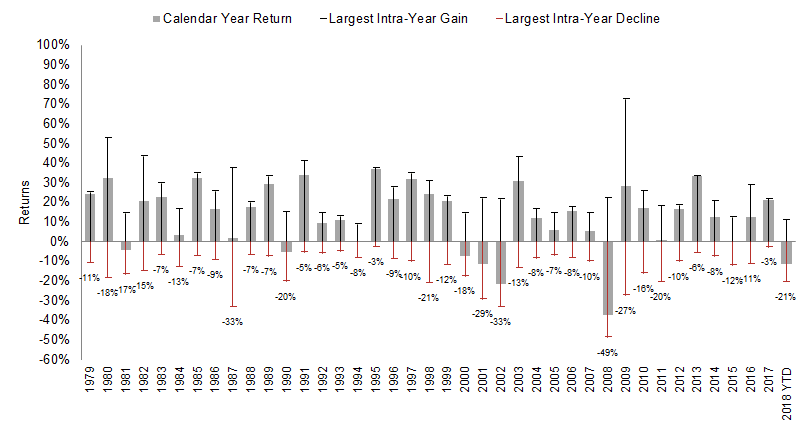
The most important conclusion we can draw from this illustration is that market pullbacks are normal and so we must plan accordingly. That is, the only regularity in the data is that pullbacks happen; given equity markets can go several years without experiencing a meaningful correction and given the range of annual pullbacks is so wide, we cannot derive a reliable trading rule to navigate around them. Thankfully, history suggests that investors are rewarded for their willingness to put capital at risk over the long-term.
At Brighton Jones, we believe the randomness and uncertainty inherent in capital markets favors those who prepare for it, not those who try to predict it. A strategy of preparedness insulates near-term cash needs from market volatility while positioning funds held in excess of near-term needs for long-term growth.
Simply knowing what to expect in terms of volatility is a critical ingredient to staying committed over the long-term.
Moreover, preparedness means that monies needed to fund obligations in the near-term will be protected in cash and high-quality bonds (i.e. not exposed to the extreme volatility of equity markets), and assets held in excess of near-term needs will be committed to a range of assets types diversified across regions, sectors, market cap, and style in order to reduce the risk associated with concentration.
By structuring portfolios around the anticipated cash needs of our clients, we are able to provide the growth side of the portfolio time to recover from pullbacks like the one we are now experiencing.
In summary, we know that shocks, crises, and pullbacks are inevitable, but with prudent portfolio construction and a long-term perspective, we are confident that outcomes for our clients will be favorable.
Guidance
In terms of investment strategy, we are not looking to make any structural adjustments to our asset class weightings at this time. But, with a 20 percent market decline and more attractive equity valuations, we will be on the lookout for opportunities to rebalance portfolios back to their target weights (which may include selling fixed income positions that have performed well and buying into the weakness of equity positions that have sold off).
We will continue to monitor this situation and provide updates as it unfolds. In the meantime, please do not hesitate to contact your planning team with any questions.
Market data is calculated off rounded daily returns. The U.S. market is the Russell 3000 Index. “Largest Intra-Year Gain” refers to the largest market increase from trough to peak during the year. “Largest Intra-Year Decline” refers to the largest market decrease from peak to trough during the year. Frank Russell Company is the source and owner of the trademarks, service marks, and copyrights related to the Russell Indexes.
Read more from our blog: