Buyer Beware: The Allure vs. Reality of Active Management
Empirical evidence points overwhelmingly to the conclusion that few investors reap the rewards promised by active management. The odds of selecting an investment strategy that outperforms its benchmark are low; the average excess return delivered by the strategies that do outperform is below a fair payout (given the low odds); and the hurdle to superior performance only becomes more daunting when considering investors are tasked with selecting not just one outperforming investment strategy, but a portfolio of them.
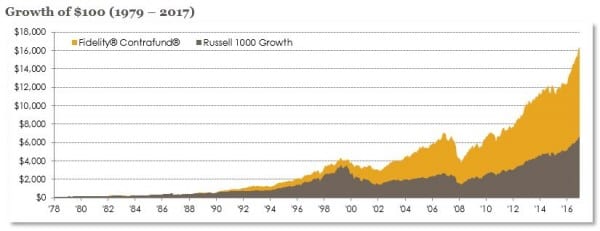
Of course, there are a select few investment strategies that have outperformed considerably over a meaningful time period, giving hope to those who insist on trying their hand at the game of active management. One such strategy is Fidelity’s Contrafund. Over the past 39 years, Contrafund has returned 14% per year, outperforming its style benchmark, the Russell 1000 Growth Index, by 2.6% per year. A hypothetical investment of $100 placed in the Russell 1000 Growth Index on January 1, 1979 would have grown to $6,580 as of year-end 2017; but the same $100 investment in Contrafund would have grown 2 ½ times that amount to $16,277 (hence, the allure of active management).
Many investors assume that if they are able to select a talented manager, a relatively smooth stream of excess returns awaits. This perception is fueled by standardized performance reporting; when investors simply see a 10- or 15-year annualized rate of return (relative to a benchmark), they may not be fully aware of the highs and lows that occurred along the path to superior performance. The performance tables and charts that investors are accustomed to often mask prolonged spells of considerable underperformance, even for investment strategies with the most sterling of long-term track records.
With most academic research focusing on the challenge of selecting top-performing managers (in advance), a less talked-about but equally important factor in active management has become overshadowed: the inconsistency inherent in the excess returns of top-performing managers.
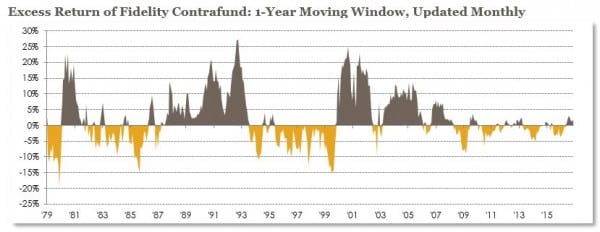
To illustrate just how bumpy the road to outperformance can be, we plot the excess return of Contrafund over 1-year moving windows, moved forward monthly (i.e. a rolling 1-year return). The data reveal that Contrafund has underperformed its benchmark in 45% of the rolling 1-year periods; and on occasion, it has underperformed by as much as 15%.
Given that 4 out of 5 investment strategies underperform their benchmark over periods of 10 years, it makes considerable sense for investors to closely monitor their line-up of actively managed strategies. After all, if you happened to select a loser, it’s better to realize the mistake early.
To monitor a roster of active managers, many investors rely on a watch list policy. That is, once a manager is hired, its performance is measured against a benchmark or peer group over a defined evaluation period. If the manager doesn’t meet the specified yardstick over consecutive evaluation periods, it is placed on a list for more intensive scrutiny.
A common practice for many investors is to place “on watch” managers who underperform on a rolling 3-year basis, thereby smoothing out the short-term noise inherent in 1-year periods. Once a manager is relegated to the dreaded watch list, it may be terminated if performance does not improve within a reasonable time frame.
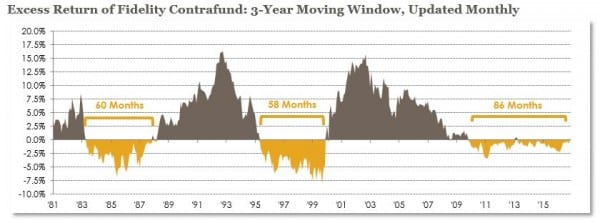
In order to apply this guideline to Contrafund, we now plot its excess return over 3-year moving windows, moved forward monthly. Not only does the data show that Contrafund has underperformed its benchmark on a rolling 3-year basis on three separate occasions, but it underperformed on a rolling 3-year basis for periods lasting 60 months, 58 months, and 86 months (and still counting). Moreover, Contrafund underperformed by as much as 7.5% per year during two of its three presumed stints on the watch list.
In the Journal of Economic Perspectives (Spring 2013), Princeton economist Burton Malkiel proclaims that “one can count on the fingers of one hand the number of equity mutual funds that have beaten the market by two percentage points or more.” In 1970, he notes, there were 358 equity mutual funds, of which only 92 survived through 2012 (hence, 266 mutual funds, or 75% of the original cohort, were liquidated, presumably due to poor performance). Of the 92 surviving managers, only 4 had outperformed by 2% or more. Fidelity’s Contrafund was one of these four, ranking it in the top 1% of potential outcomes.
Still, Malkiel’s analysis illustrates only half the challenge investors face if they insist on playing their hand in the game of active management. Indeed, the odds of selecting a top performing manager are low. But we could argue, albeit subjectively, that sticking with a manager (who ultimately outperforms) throughout its inevitable periods of underperformance is even more difficult! Could you stay invested in a manager that missed its mark for 60 consecutive months, having underperformed by as much as 7.5% per year over a 3-year period? Ironically, the same policies and procedures that investors design to protect themselves from persistent underperformers may cause them to give up on the strategies that defy the odds and ultimately deliver superior results.
Read more from our blog: